
Figure 5.
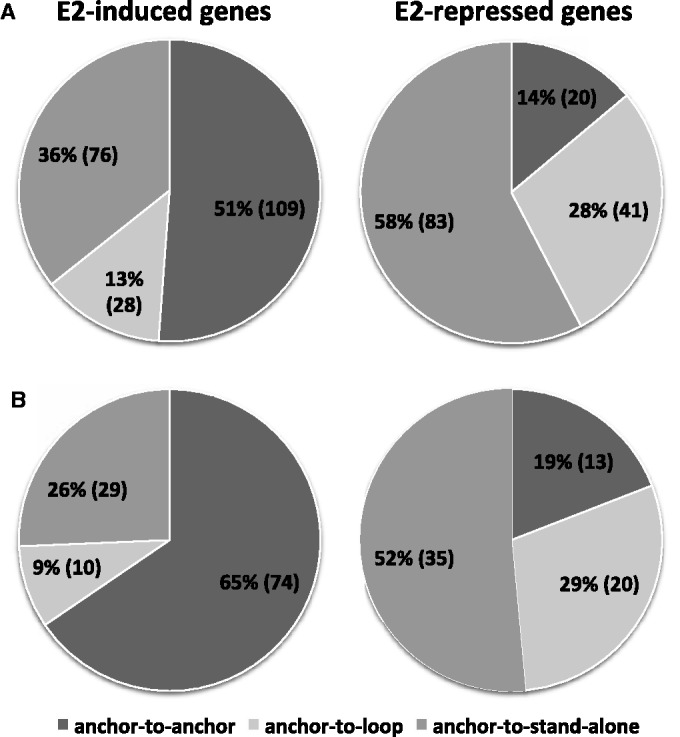
The distribution of the positional transitions of the estrogen-induced and estrogen-repressed genes. This figure shows the impact of estrogen treatment on chromatin reconfiguration (a gene within a Pol II anchor region was categorized as a loop or standalone gene with respect to ER complex after estrogen treatment) (A) Number of gene in each positional transitional pattern group (anchor-to-anchor, anchor-to-loop, anchor-to-stand-alone) for estrogen-induced and estrogen-repressed genes. (B) Positional transition pattern distribution of estrogen-responsive genes that had ERα binding in the anchor region of the original Pol II complexes in the absence of ligand.