Figure 6.
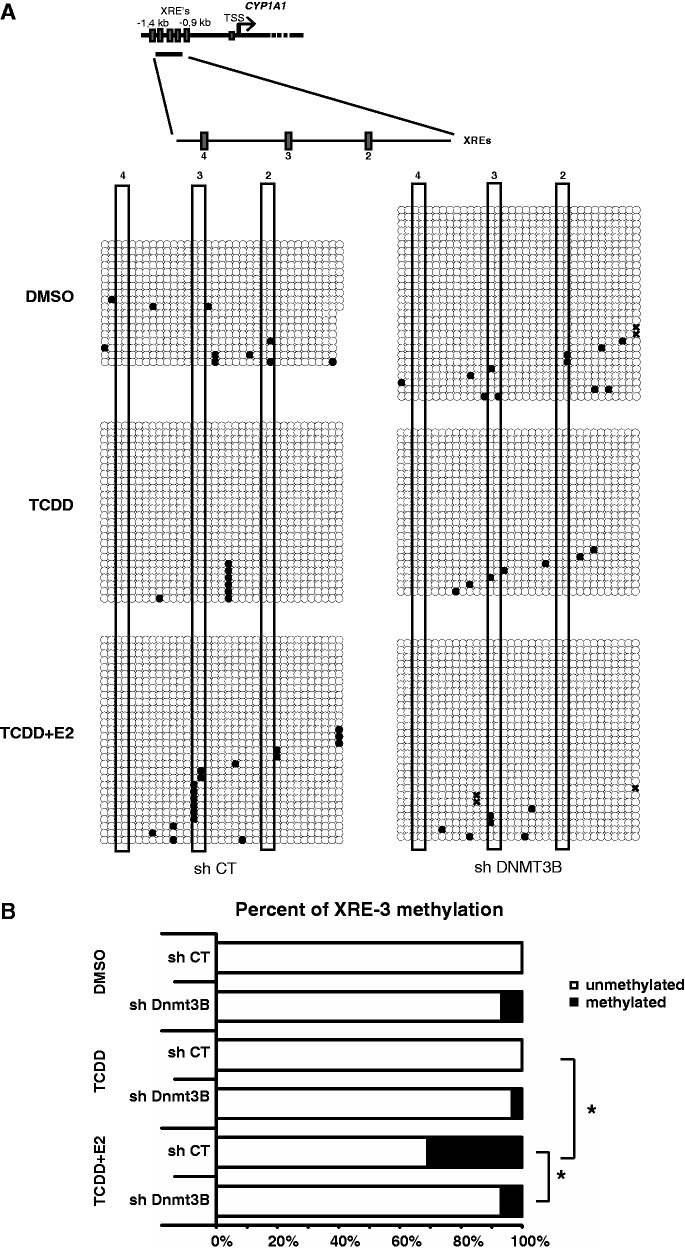
ERα induces DNA methylation at the XRE-3 of the CYP1A1 promoter. (A) Schematic representation of the CYP1A1 promoter and XRE positions. Bisulfite sequencing was performed in MCF7 cells infected with shCT or shDnmt3B constructs, grown in estrogen-free media for 3 days and treated with DMSO, TCDD or TCDD + E2 for 24 h. XRE’s are numbered relatively to their positions from the TSS of CYP1A1, and each red rectangles represent one XRE. (B) Graphical representation of the percentage of unmethylated and methylated CpGs in XRE-3 (*P < 0.05).

