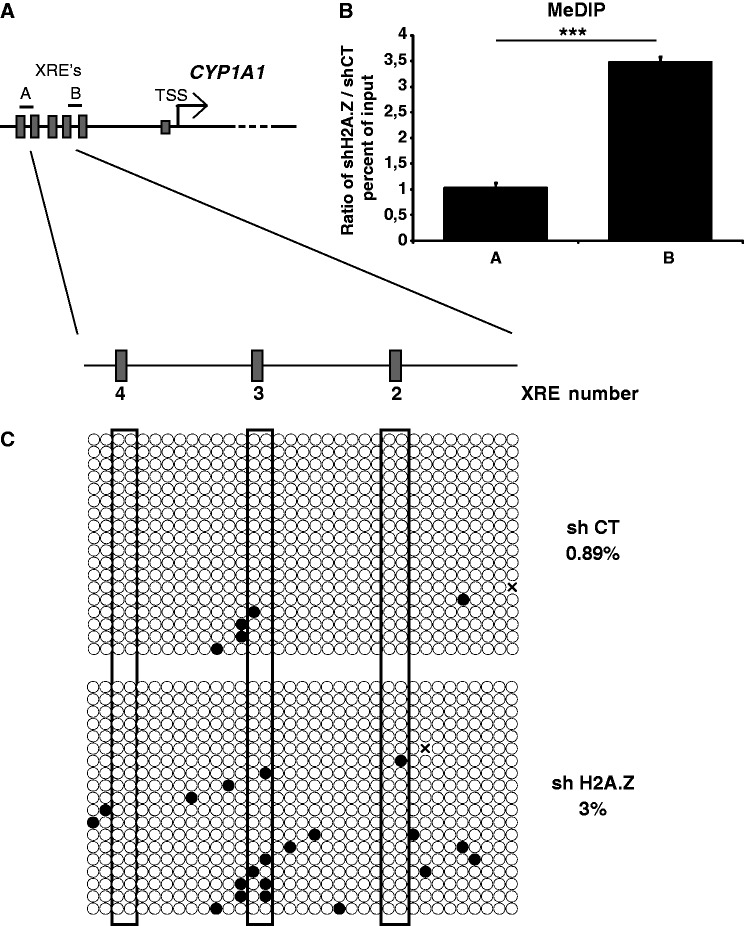
Figure 7.
H2A.Z depletion promotes DNA methylation at the CYP1A1 promoter. (A) Schematic representation of the CYP1A1 promoter. The position of the amplicons A and B used in the qPCR analyses are illustrated. (B) MeDIP was performed in MCF7 cells infected with shCT or shH2A.Z constructs for 5 days. (C) Bisulfite sequencing were performed in MCF7 cells infected with shCT or shH2A.Z constructs and grown in DMEM 10% FBS for 5 days.

