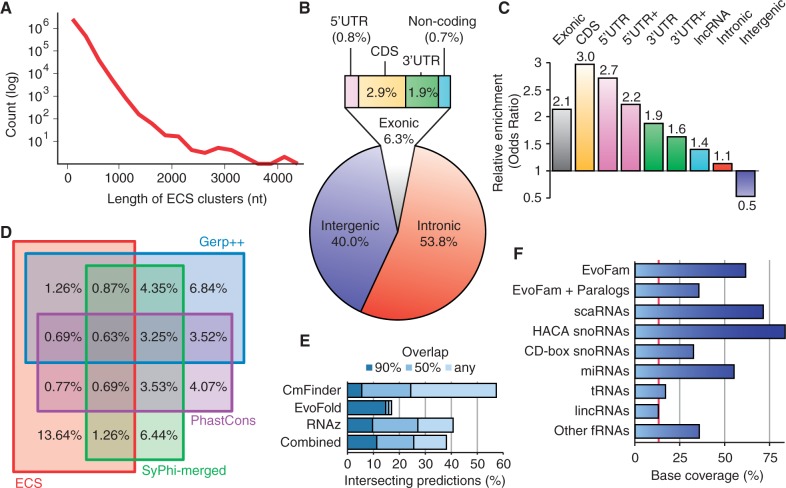
Figure 4.
Genomic coverage and distribution of ECS predictions. (A) Size distribution of predicted ECS clusters. (B) Genomic distribution of ECS predictions with respect to the comprehensive GENCODE (version 14) genome annotations (51). Intergenic regions are defined as nonintronic or exonic regions. (C) Enrichment of ECS predictions in specific genomic features. The odds ratios are calculated as the ratio of ECS:nonECS base coverage in the specified genomic features compared with that outside said features, as defined by GENCODE annotations (version 14). UTR+ regions correspond to annotated untranslated regions with 250 and 2500 additional nucleotides flanking the 5′- and 3′-ends, respectively. (D) Venn diagram of the inclusive overlap between ECS predictions and known sequence-constrained elements. SiPhy-merged corresponds to the combined SiPhy-ω and SiPhy-π sets from (52). Mammalian PhastCons elements were extracted from the UCSC genome browser (hg19). GERP++ elements for 35 eutherian mammals were downloaded from Ensembl (release 65). Both SiPhy and PhastCons elements are derived from Multiz alignments, whereas ECS and Gerp++ are derived from EPO alignments of 35 eutherian mammals. (E) Fraction of predictions from previous screens that partially overlap the ECSs from SISSIz and RNAz disclosed in this study. CMfinder (version 0.2)-predicted RNA structures are taken from the ENCODE pilot project data (18), which surveyed Multiz alignments of 16 vertebrates. EvoFold (version 2.0) predictions stem from the mammalian portion of Multiz 41 vertebrate alignments (53). RNAz (version 1.0) predictions stem from Multiz alignments of eight vertebrates as reported in (19). Intersections were performed with bedTools (54). (F) Detection of known and putative functional RNAs: microRNAs from miRBase 15 (55); small nucleolar RNAs and small Cajal body-specfic RNAs from snoRNABase 3 (56); transfer RNAs from tRNAscan-SE 1.23 (57); large intergenic ncRNAs from the Human Body Map (58); EvoFam ECS predictions (and paralogs) from 29 mammals (53); other RNAs corresponding to a comprehensive set of structural RNA annotations (http://moma.ki.au.dk/prj/mammals/). The red line indicates the observed genomic background coverage (13.6%) by ECSs reported in this manuscript.

