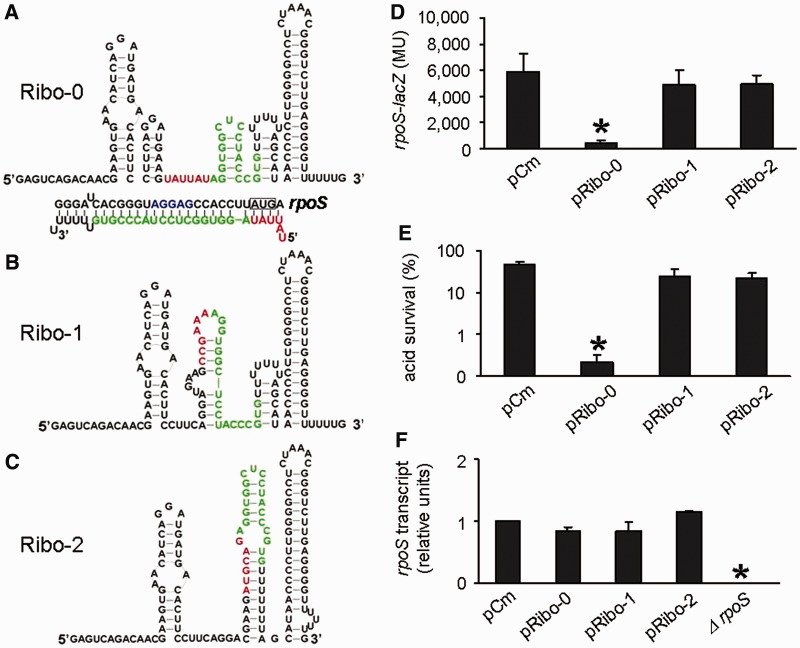
Figure 2.
Repression of rpoS expression by the artificial sRNA Ribo-0. (A) Predicted secondary structures and verified sequences of Ribo-0, (B) Ribo-1 and (C) Ribo-2. The color scheme used: the 6-nt random sequence, red; the base-pairing domain, green. (D) Regulation of chromosomal rpoS-lacZ fusion by Ribo-0, Ribo-1 and Ribo-2. The rpoS fusion expression was determined using beta-galactosidase assays. (E) Regulation of acid resistance by Ribo-0, Ribo-1 and Ribo-2. Survival percentages after 2 h of acid treatment (pH 2.0) were determined by counting CFUs. (F) Effects of Ribo-0, Ribo-1 and Ribo-2 on rpoS mRNA levels. rpoS transcripts were quantified using real-time PCR. The 16S RNA was used as an internal control to ensure comparability of the samples. In experiments shown in Figures (D), (E) and (F), cells carrying pCm (an empty control) served as a negative control in addition to those overproducing Ribo-1 and Ribo-2. Error bars represent standard deviation (*P < 0.05).

