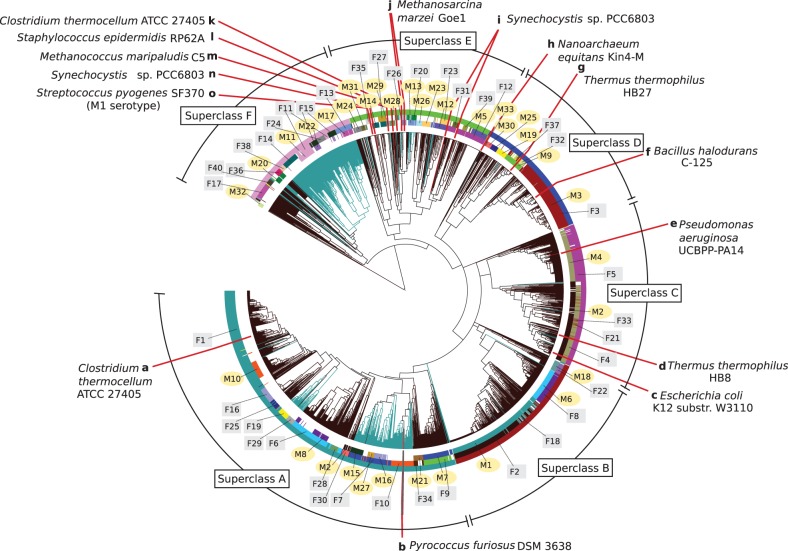
Figure 1.
The CRISPRmap tree: a map of repeat sequence and structure conservation. The hierarchical tree is generated with respect to repeat sequence and structure pairwise similarity and the branches are coloured according to their occurrence in the domains bacteria (dark brown) or archaea (blue-green). The rings annotate the conserved structure motifs (inner), sequence families (middle) and the superclass (outer). Motifs and families are marked and highlighted with yellow circles, and grey squares, respectively. Finally, we marked locations of published CRISPR-Cas systems for which experimental evidence of the processing mechanism exists (13,17–25,33–36,51). A summary for these published systems is given in Supplementary Table S20. Repeats that show no conservation, i.e. were not assigned to either a sequence family or structure motif, were removed to clarify the visualisation.

