Figure 4.

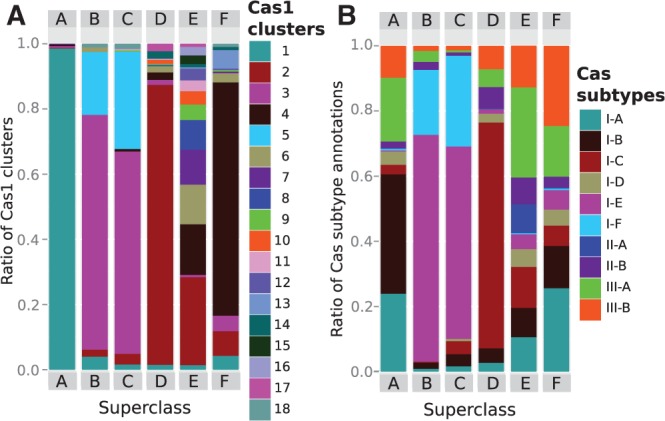
Relative ratios of Cas1 sequence clusters and Cas-subtype annotations per superclass. (A) Cas1 sequence clusters correspond well to the superclass and thus the CRISPRmap tree with the exception of superclass E; superclass E is diverse in both repeat and associated Cas1 conservation and it probably contains only partial data. (B) Bacterial CRISPRs that are assigned to well-defined structure motifs are associated with subtypes I-C, I-E and I-F in superclasses B–D and are strongly linked to both repeat and Cas1-sequence similarities (i.e. CRISPR evolution). Superclass A and F contain both bacterial and archaeal CRISPRs (many are unstructured), which are loosely associated with the remaining type I and both type III subtypes. These subtypes do not correspond to Cas1 and repeat evolution and are likely composed of interchangeable protein complexes or modules. The diversity of superclass E is also reflected by the mixture of all subtypes; in addition, the majority of type II CRISPRs are also located in this region.
