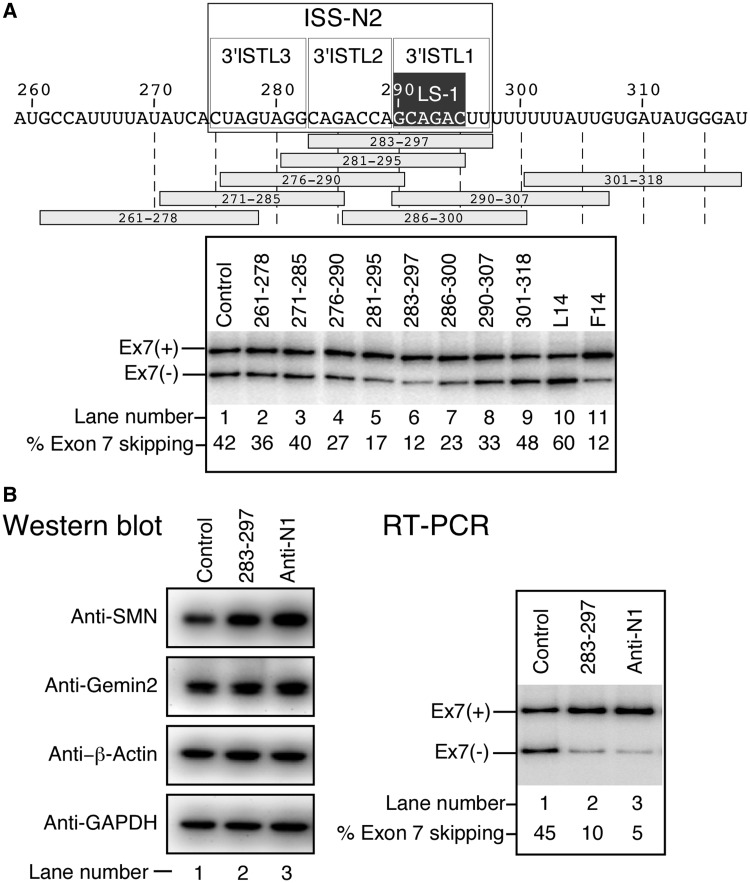
Figure 11.
Effect of ASOs on splicing of endogenous SMN2 exon 7 in SMA patient cells. (A) Diagrammatic representation of the region of intron 7 targeted by the indicated ASOs. Numbering of nucleotides starts from the beginning of intron 7. Areas corresponding to the 3′ strands of ISTLs as well as ISS-N2 are indicated. ASOs are shown as horizontal bars. ASO name indicates the first and the last position of their target site in intron 7. SMA patient fibroblasts (GM03813) were transfected with 15 nM of a given ASO and total RNA was harvested at 24 h post transfection. Control ASO was the same as described in Figure 2. Results were analyzed as described in (35). (B) Effect of the stimulatory ASOs on levels of cellular proteins in SMA patient cells. GM03813 cells were transfected with 40 nM of a given ASO, and cells were harvested at 48 h post-transfection. Splicing pattern and protein levels were determined as in (35).

