
Figure 2.

Identification of first-generation trees. In this example, the aggregate signal frequency vector  is consistent with three first-generation trees
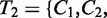
 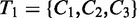 ,
, 
 and
and 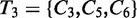 . Each first-generation tree is visualized as a matrix equation
 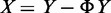 according to Equation (2) (left) and as a partial evolutionary tree (right). In the bottom row, the partial tree PT1 given by the union of the partial trees T1 and T3 is shown. Question marks indicate values that are unknown as they are not specified by the first-generation tree or by the partial tree.