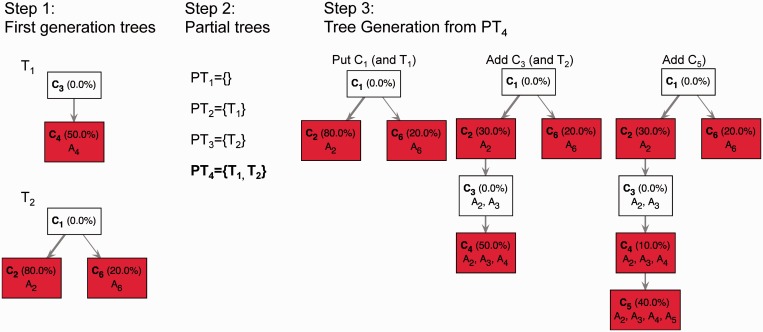
Figure 3.
Illustration of the usage of first-generation trees and partial trees for deriving the TrAp solution of a mixture of four subclones. In this example, five aberrations were measured from an aggregate sample and their frequencies were  ,
,  ,
,  ,
,  and
and  , respectively. The dummy measurement
  was also added to generate the aggregate signal frequency vector
  . In the first step, TrAp identifies all first-generation trees, namely
  and
and  . In the second step, TrAp generates the possible partial trees, namely
  ,
,  ,
,  and
and  , and consequently selects only
  , as it is the only partial tree that contains a maximum number of first-generation trees. In the third step, TrAp generates evolutionary trees starting from the partial tree
  . To complete the evolutionary tree starting from PT4, the subclone C1 is positioned as the root of the tree. Because C1 is part of the first-generation tree T1, the subclones C2 and C6 are automatically added as direct descendants of C1. Next, C3 is added as a direct descendant of C2. Because C3 is part of the first-generation tree T2, C4 is automatically added as direct descendant of C3. Finally, C5 is added as a direct descendant of C4, generating the optimal TrAp solution to the subclonal deconvolution problem. We remark that the optimal solution generated by the TrAp algorithm is equal to the left solution of Supplementary Figure S1 and to solution
  in Supplementary Figure S2.

