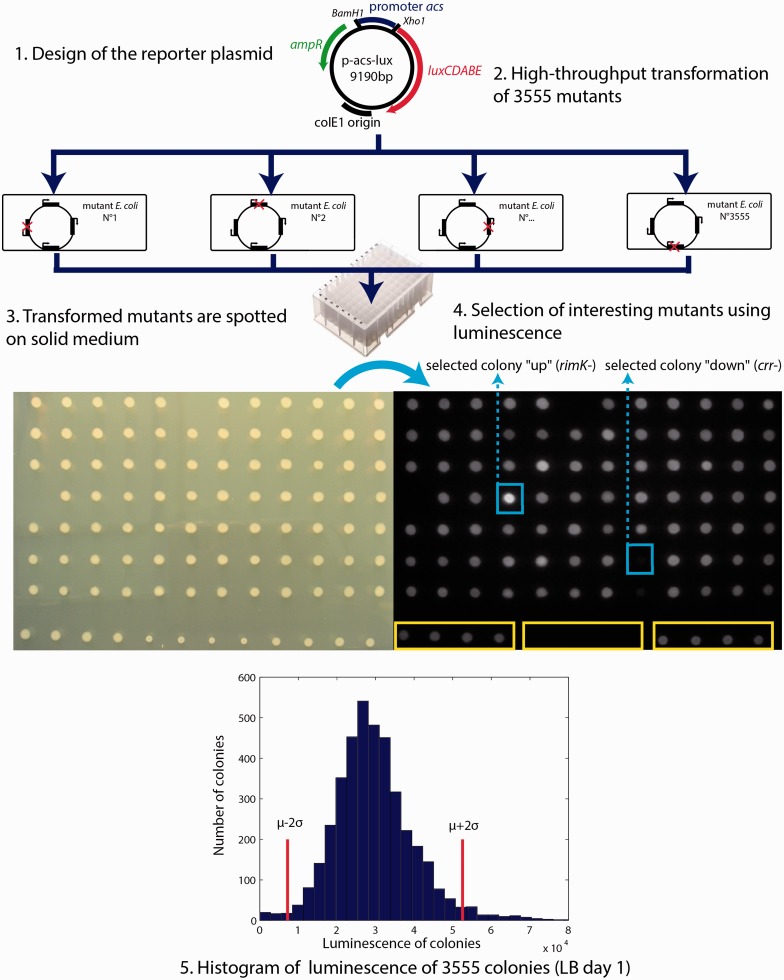
Figure 1.
A screening strategy for identifying new regulators: The acs promoter region was cloned upstream of the luxCDABE operon on a low-copy number plasmid. This plasmid is transformed into 3555 single knockout mutants of E. coli (top). The transformed bacteria were spotted onto solid LB-agar medium and the luminescence of the colonies was quantified (LB day 1) (middle). The histogram (bottom) shows the observed distribution of luminescence emitted by all colonies. The red vertical lines indicate two standard deviations above and below the mean. The names of the mutants with luciferase activity differing by more than two standard deviations from the mean are listed in Supplementary Information S4. The coefficient of variation (CV) of the observed distribution, obtained by dividing the standard deviation by the mean, equals 0.38.

