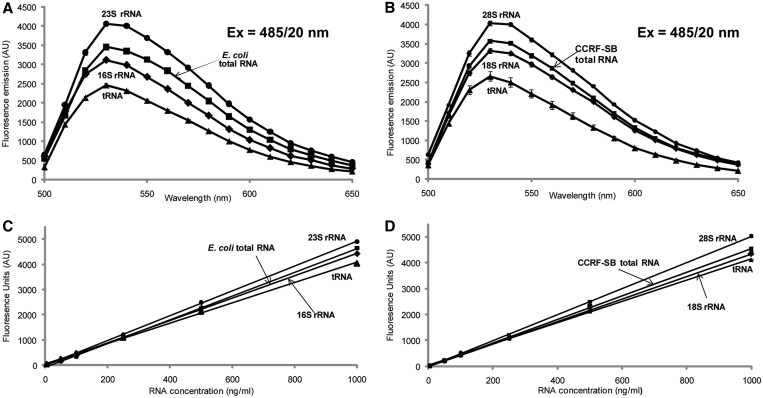
Figure 5.
Fluorometric quantitation of purified RNA using RiboGreen with adjustments for species-specific responses. (A) Fluorescence enhancement of RiboGreen on binding to E. coli total RNA (black square) and HPLC purified E. coli 23S rRNA (black circle), 16S rRNA (black diamond) and tRNA (black triangle). (B) Fluorescence enhancement of RiboGreen on binding to CCRF-SB total RNA (black square) and HPLC purified CCRF-SB 28S rRNA (black circle), 18S rRNA (black diamond) and tRNA (black triangle). (C) RNA concentration curves of E. coli total RNA (black square) and HPLC purified E coli 23S rRNA (black circle), 16S rRNA (black diamond) and tRNA (black triangle). (D) RNA concentration curves of CCRF-SB total RNA (black square) and HPLC purified CCRF-SB 28S rRNA (black circle), 18S rRNA (black diamond) and tRNA (black triangle). The fluorescence of each RNA species with concentrations from 0 to 1000 ng/ml stained with RiboGreen was measured for fluorescence at 528/20 nm.

