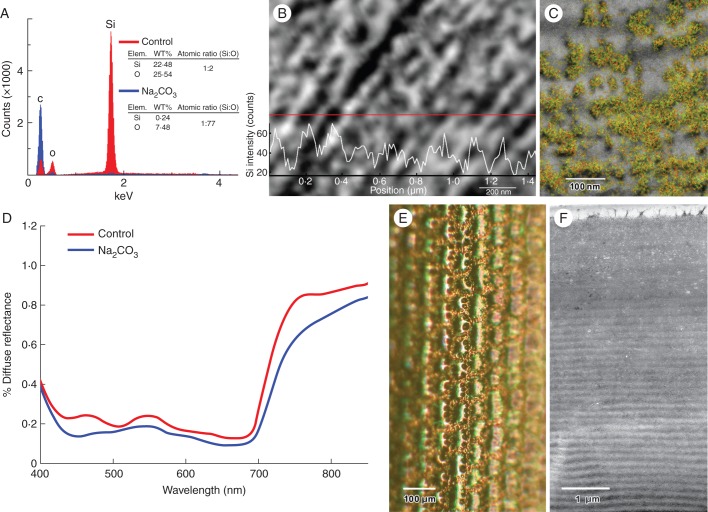
Fig. 3.
Detection, distribution and removal of silica from adaxial epidermal cell walls. (A) Energy dispersive X-ray spectra of electron-opaque granular particles near the adaxial surface (red) versus control (blue) reveal strong signal peaks for silicon and oxygen in granular region corresponding with the presence of silica (SiO2). The approximate ratio of 2:1 is consistent with the presence of SiO2. (B) EDXA line scans transecting particle-decorated microfibrillar lamellar regions indicate Si energy-related peaks correlate closely with electron opaque granular bodies. (C) Semi-quantitative EDXA map combining the red silicon Kα1 peak values with the green oxygen Kα1 peak values. Electron-opaque granules in this scanning transmission electron micrograph correlate closely with the yellow label of the SiO2 signal. (D) Surface reflectance of Na2CO3-treated leaves (blue line) indicates preferential depletion of biogenic silica near the blue peak compared with control treatments (red line). Reflectance is based on mean of three scans for each treatment (n = 5 leaves). (E) Leaf treated with Na2CO3 displays loss of iridescence with depletion of biogenic silica. (F) TEM image confirms loss of electron-opaque silica inclusions from adaxial cell walls after incubation of leaf in Na2CO3 (cf. Fig. 2C).

