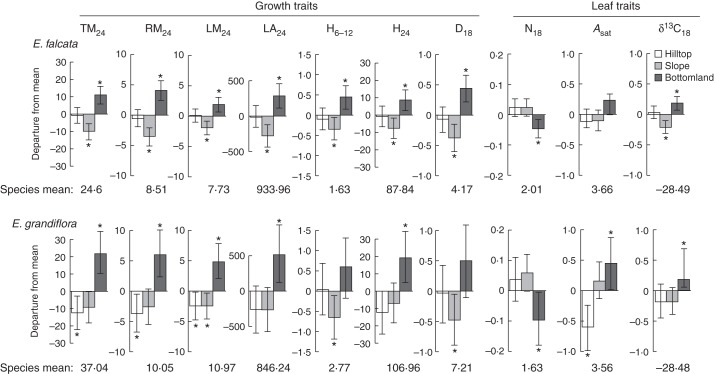
Fig. 2.
Phenotypic differentiation among habitat types for growth, biomass allocation and leaf traits for Eperua falcata (top) and E. grandiflora (below) sampled at Paracou, French Guiana. Bayesian estimates of departures of each group from the global mean are shown as boxes; t-bars show the 95 % Bayesian credible interval of the estimated parameters. Figures above each plot provide the within-species trait means, which correspond to the zero value in the plots. Units for each trait are provided in Table 1. Hilltop, slope and bottomland are as indicated in the key in the top panel. Asterisks indicate a significant effect of habitat type (95 % CI intervals do not overlap 0).

