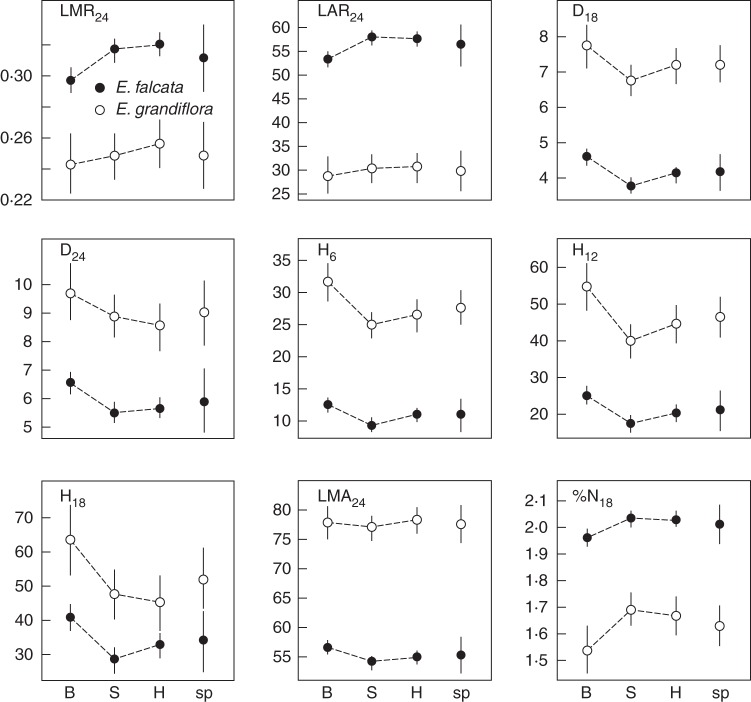
Fig. 3.
Comparison of the direction of trait value change between habitats (within species) and between species for traits with significant differences both at the intraspecific and at the interspecific level (see Supplementary Data, Tables S3–S6 for raw results). Trait names and units are as described in Table 1. B, bottomlands; S, slopes; H, hilltops; sp, species-level values. Bayesian posterior medians for Eperua falcataand E. grandiflora as indicated in the key in the first graph. Error bars are Bayesian 95 % credible intervals; non-overlapping credible intervals between two values imply significant differences (95 % CI intervals do not overlap 0).

