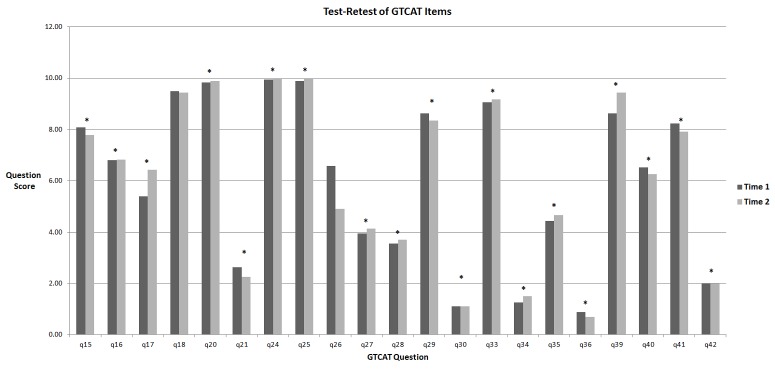
FIGURE 3.

Mean Likert scores for the 21 Likert scale questions at Time 1 (initial visit) and Time 2 (3-month visit) in 35 participants with glaucoma or ocular hypertension. The asterisks(*) indicate that the Spearman’s rho shows statistically significant nonparametric correlation (P≤.05) between Time 1 and Time 2 for all questions except Q18 and Q26. Glaucoma Treatment Compliance Assessment Tool Study.
