Fig. 3.

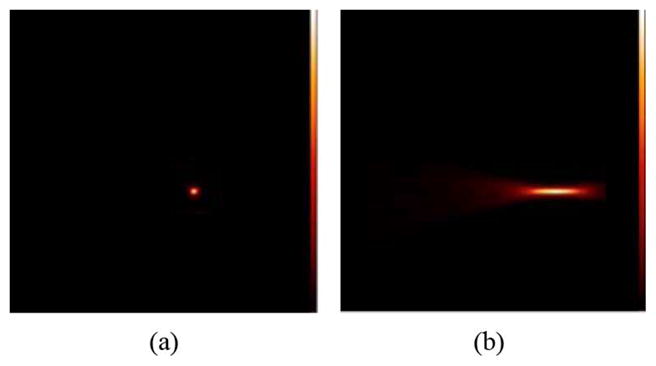
Images of the point source phantom (distance from the small detector = 9 mm) (a) Activity distribution of the point source in the x-y-plane and (b) In the x-z plane. Images obtained using MLEM reconstruction.

Images of the point source phantom (distance from the small detector = 9 mm) (a) Activity distribution of the point source in the x-y-plane and (b) In the x-z plane. Images obtained using MLEM reconstruction.