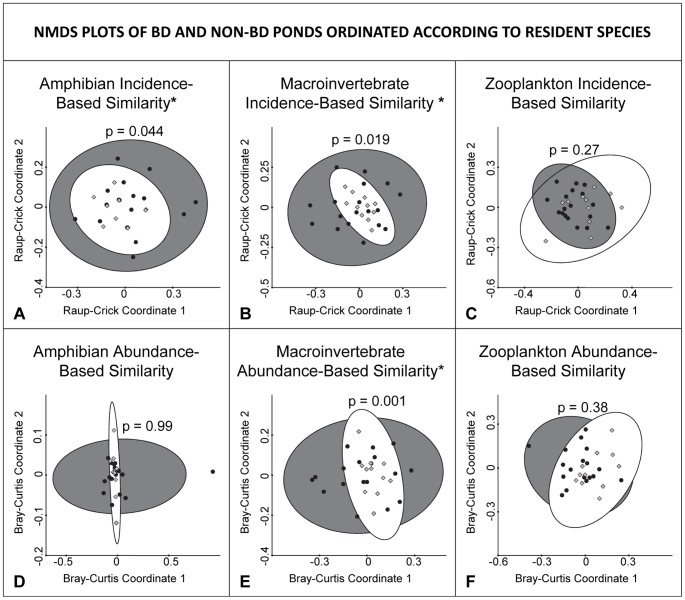
Figure 2. NMDS plots of Bd and non-Bd ponds according to their resident species.
Ponds are ordinated according to Raup-Crick incidence-based indices (top row; A, B, and C) and Bray-Curtis abundance-based indices (bottom row; D, E, and F) of resident amphibian (left column; A and D), macroinvertebrate (center column; B and E), and zooplankton (right column; C and F) species. Bd ponds are light gray diamonds (encircled by the white 95% confidence ellipse) and non-Bd ponds are black circles (encircled by the dark 95% confidence ellipse). Ponds that are closer together are more similar to each other. In incidence-based ordinations (A, B, and C), dispersion distance is analogous to beta diversity. Dispersion difference is significantly lower (*) for groups of Bd ponds in A, B, and E.

