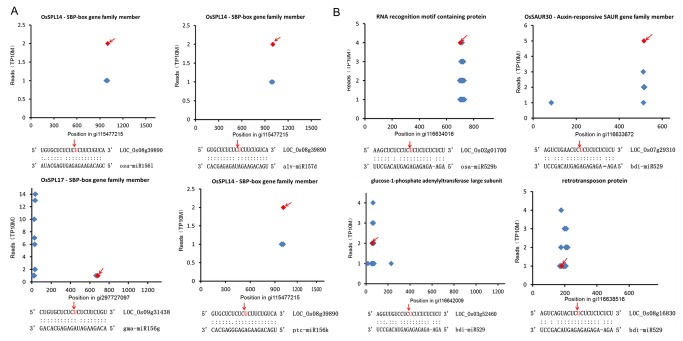
Figure 6. Identified miRNA targets by degradome sequencing are presented in the form of t-plots.
The T-plots which were referred to as ‘target plots’ by German et al indicated the distribution of the degradome tags along the sequences of targets (top). The alignment of mRNA: miRNA show the matching degree between miRNA and its target sequence (bottom). The two dots indicate matched RNA base pairs; one dot indicates a GU mismatch. The red spot and arrow represents the sliced target site. The y-axis measures the intensity of the cleavage signal, and the x-axis indicates the position of the cleavage signal on a specific transcript. (A) Regulation of SBP-box gene family by miR156 and miR157 family identified by degradome sequencing. (B) Different target genes cleaved by the miR529 family.

