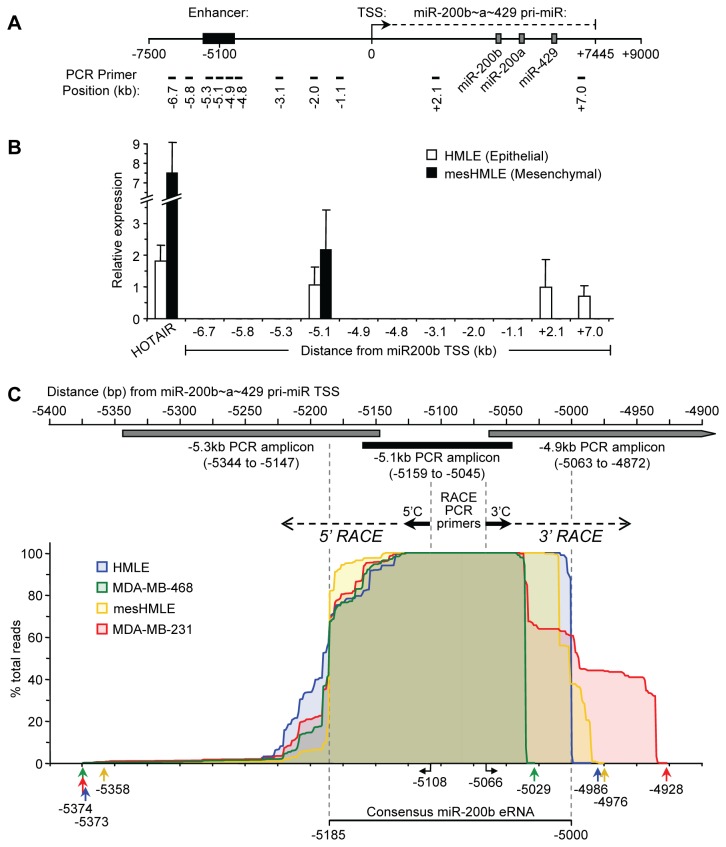
Figure 3. miR-200b eRNA is transcribed from the upstream intergenic enhancer region of miR-200b~200a~429.
(A) Schematic representation of the miR-200b~200a~429 locus. Black box indicates the position of the potential enhancer. A black arrow marks the TSS direction of the primary miR-200b~200a~429 transcript. Grey boxes indicated the mature miR-200b, miR-200a and miR-429 genes. Black bars indicate the positions (in kilobases, kb) of the PCR primers used for qRT-PCR. (B) Expression levels of HOTAIR, miR-200b eRNA and the primary miR-200b~200a~429 transcript as determined by qRT-PCR in epithelial and mesenchymal HMLE cells using random hexamer primed cDNA synthesized from total RNA. The x-axis shows the distance from the miR-200b~200a~429 TSS in kb. Data represents mean ± SD of three independent experiments. (C) Schematic representation of the enhancer region located relative to the miR-200b~200a~429 TSS. Boxes indicate the locations of PCR amplicons used to detect the miR-200b eRNA in Figure 3B. RACE PCR primers and their start locations relative to the miR-200b~200a~429 are indicated. 5’ and 3’ RACE-seq analysis of the miR-200b eRNA with cDNA prepared from total RNA of HMLE, mesHMLE, MDA-MB-468 and MDA-MB-231 cells as described in the Materials and Methods. 5’ and 3’ ends of the miR-200b eRNA transcript are mapped as % total reads for each cell line with extreme 5’ and 3’ ends indicated by colored arrows below. A consensus miR-200b eRNA transcript is indicated.

