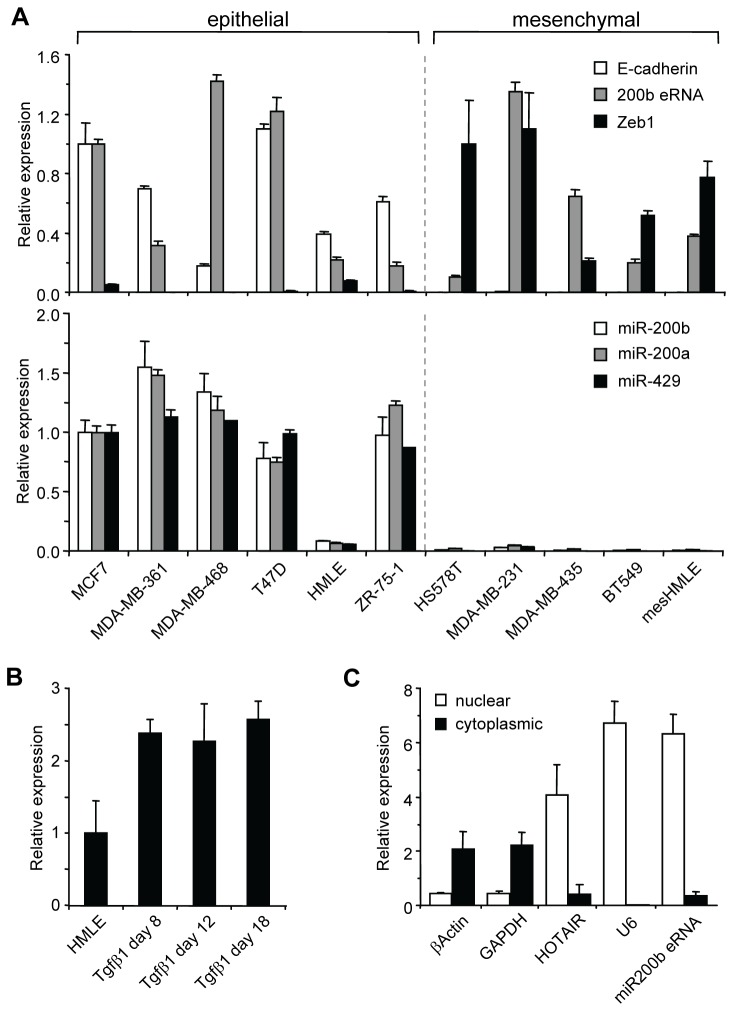
Figure 4. Gene expression analysis of miR-200b eRNA, miR-200b~200a~429 and EMT-affiliated genes.
(A) Real-time PCR of miR-200b eRNA, EMT markers and miR-200 genes in a panel of breast epithelial and mesenchymal cell lines. mRNA (top panel) is normalized to GAPDH while miRNA (bottom panel) is normalized to U6 snRNA. Comparative quantitation was used to determine expression profiles of the genes in the cell line panel. Expression of E-cadherin and miR-200b eRNA in HMLE cells is set to a value of 1, whereas Zeb-1 is expressed relative to mesHMLE cells having a value of 1. Error bars represent mean ± SD of three independent experiments. (B) Relative expression levels of miR-200b eRNA during EMT time course of HMLE cells treated with TGF-β1 for up to 18 days. The realtime PCR data is normalized to GAPDH. Expression of miR-200b eRNA is set to a value of 1 in HMLE cells (C) Relative concentration of miR-200b eRNA, U6, HOTAIR, GAPDH and βActin RNA transcripts in the nucleus and cytoplasm of HMLE cells. Absolute quantitation was used to determine the expression level of each gene in the cytoplasmic and nuclear fractions. Error bars represent mean ± SD of three independent experiments.

