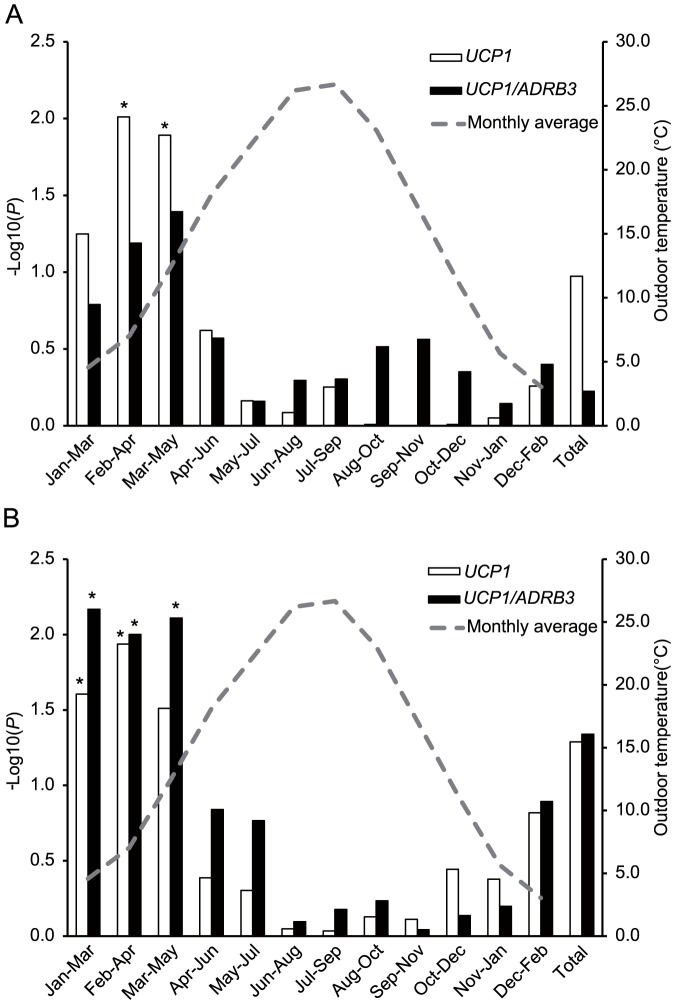
Figure 1. Effects of sampling season on associations with A) VFA and B) VFA adjusted for BMI.
The –log of P-values for UCP1 and UCP1/ADRB3 in individuals sampled in windows of successive 3 months. Average outdoor temperatures in the second month of each 3-month window are shown with a gray broken line. *: P<0.05 after applying Bonferroni correction.

