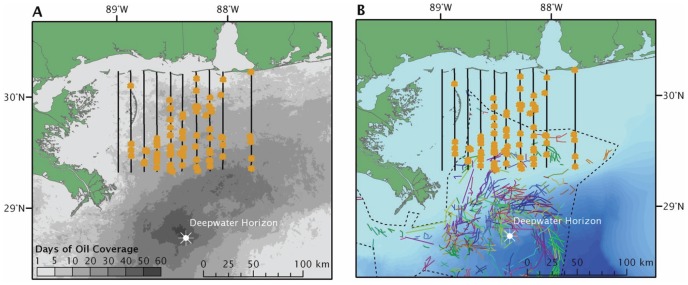
Figure 3. Sargassum targets in relation to oil and dispersant.
Locations of Sargassum targets (yellow dots) identified along aerial flight transects (black lines) in 2010 relative to days of oil coverage (A) and application of dispersants (B). Transect 1, the dotted transect, was not flown in 2010 due to spill-related flight restrictions. In A, cumulative surface oiled was calculated through the analysis of NESDIS satellite imagery [*]. In B, the colored lines represent daily aerial spraying tracks and the dashed polygon is the full envelope of the effective area [2]. [*] Cumulative surface oiling of the Deepwater Horizon oil spill (2010) The Nature Conservancy, Coastal Resilience Gulf of Mexico Project (http://coastalresilience.org/gulfmex). Accessed November 7, 2012.

