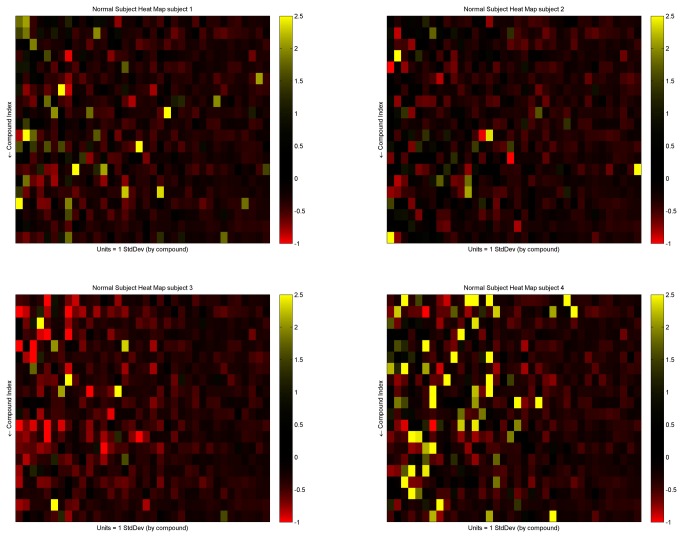
Figure 3. Heat maps of breath VOCs.
The abundance of VOCs with an alveolar gradient greater than zero is shown in four randomly selected subjects (Figure 3). Color coding indicates the number of standard deviations by which the abundance of a VOC in an individual differs from the mean abundance in all subjects.

