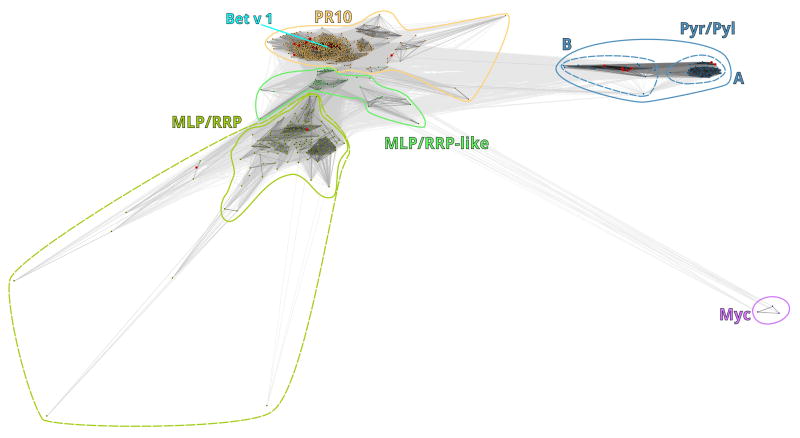
Figure 1.
Two-dimensional representation of the CLANS clustering results. Proteins are shown as black dots. Proteins with known structures are shown as red dots. Lines indicate sequence similarities detected by BLAST and are colored by a grayscale spectrum according to BLAST’s P-value (black: P-value < 10−255, light grey: P-value < 10−5).

