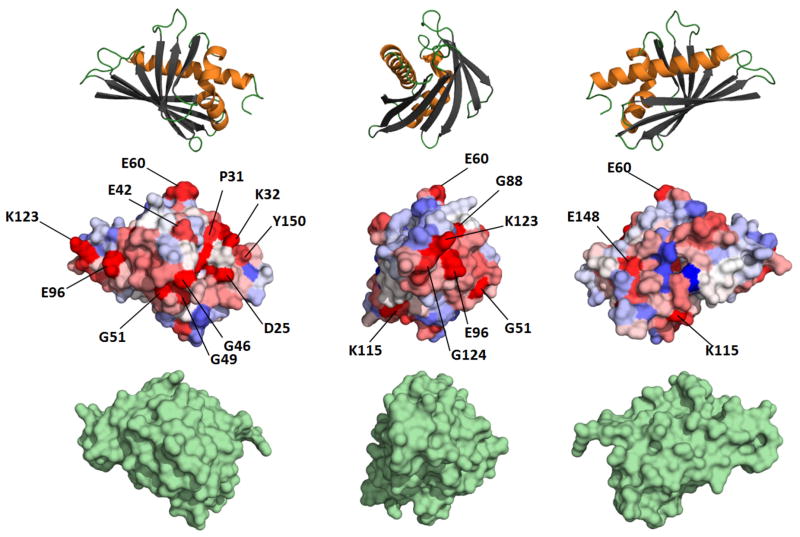
Figure 8.
Sequence conservation of Bet v 1-like allergens. Upper part of the panel shows Bet v 1 molecules in ribbon representation at the same orientation as the middle part. The middle part of the panel shows conservation of surface residues mapped on Bet v 1 (red – the most conserved residues, blue - the least conserved residues). The most conserved residues are labeled. Lower part of the panel shows Act d 11 in surface representation. The orientation of Act d 11 is the same as Bet v 1.

