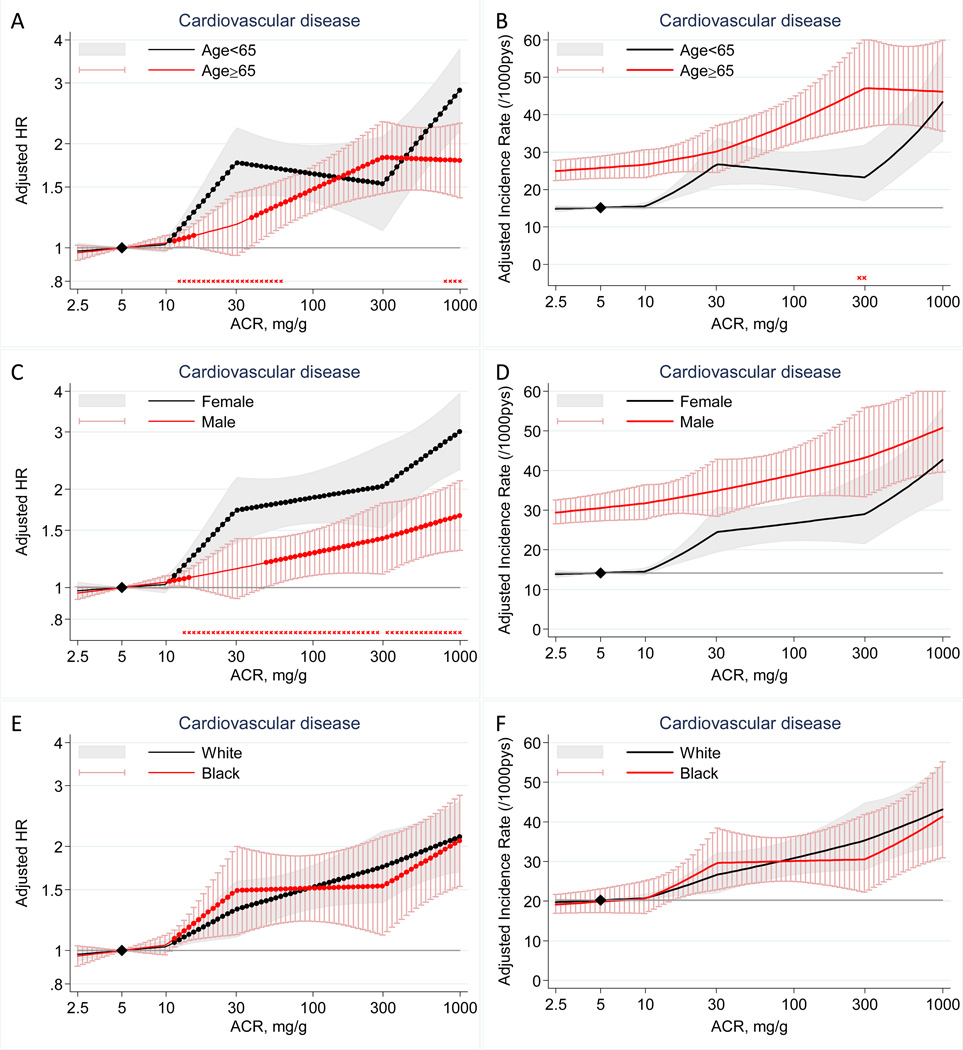
Figure 2.
Adjusted hazard ratios (left panels) and adjusted incidence rates (right panels) and 95% CIs (shaded areas or whisker plots) of cardiovascular disease according to ACR with 5 mg/g as a reference (diamond) in each subgroup (left panels) and in the reference subgroup (right panels) of age (A–B), sex (C–D), and race (E–F). Dots on each plotted line represent statistical significance (P<0.05). Stars placed just above the y axis represent significant point-wise interactions (P<0.05) between two subgroups in multiplicative (left panels) and additive (right panels) scale (absence of stars indicates no significant point-wise interaction). Adjustments were for age, sex, race, smoking, history of cardiovascular disease, systolic blood pressure, diabetes, total cholesterol concentration, body mass index, and eGFR splines.

