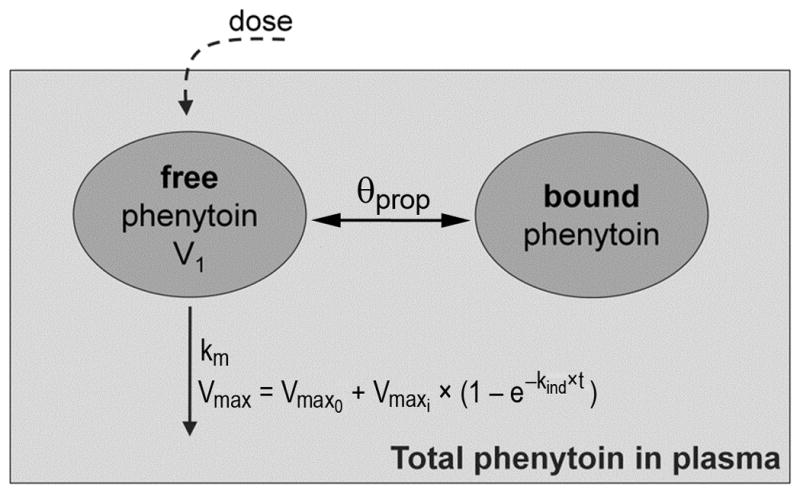
Figure 1. Schematic representation of the selected pharmacokinetic model.

Two compartments represent the amount of free phenytoin (unbound) and of bound drug in plasma. V1 is the volume of distribution, θprop is the proportionality constant between the bound and unbound drug amounts, km is the Michaelis-Menten elimination rate constant (mg/L), Vmax is the maximum velocity of metabolism (mg/h), Vmax0 is the time-invariant maximum velocity of metabolism at baseline (mg/h), Vmaxi is the time-dependent velocity defined by the rate constant kind (h−1) and t is time (h). The total amount of phenytoin in plasma is the sum of unbound and bound phenytoin.
