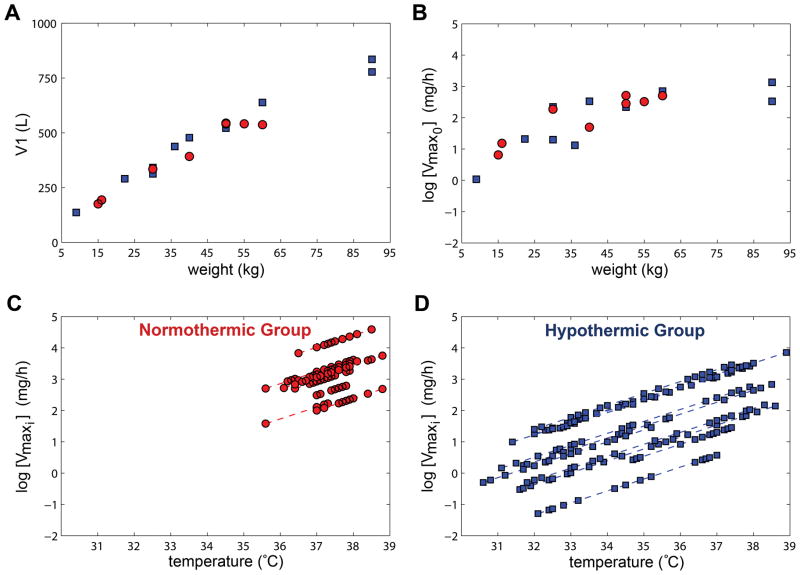
Figure 3. Impact of covariates on the estimated pharmacokinetic parameters.
Circles(red) and squares(blue) are patients in the normothermic and hypothermic groups, respectively. A/B. Estimates of volume distribution (V1) and time-invariant maximum velocity of metabolism at baseline (Vmax0) for each patient is positively-correlated with weight. C/D. Estimated time-dependent velocity of metabolism (Vmaxi) on the log scale is reduced with lower temperatures for the normothermic and hypothermic patients versus temperature.

