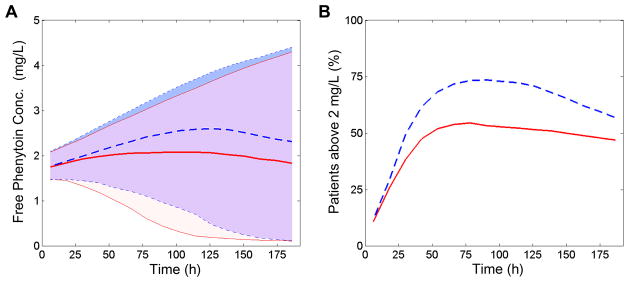
Figure 4. The magnitude and timing of the effects of temperature on free phenytoin concentrations.

Simulations of 1000 children receiving either therapeutic hypothermia or controlled normothermia. Solid lines/lightest(red) shading represents the normothermic group while dashed lines/darkest(blue) shading represents the hypothermic group. The simulated fosphenytoin dosing schedule was 20 mg/kg IV loading dose followed by 6 mg/kg/day divided every 12 h. The cooling protocol involved hypothermia induction over 6 h to 33 °C, hold at 33 °C for 48 h, and then slow rewarming (1 °C per 24 h) to 37 °C (depicted in Figure E3, Supplemental Digital Content). Controlled normothermia patients were fixed at 37 °C. All individuals were simulated with a weight of 40 kg. A. Unbound phenytoin concentrations are elevated in patients receiving hypothermia versus normothermia as shown by the population predicted median (lines) and 90% confidence interval (shading) over time. B. Percentage of simulated children with free phenytoin concentrations above the 2 mg/L toxicity threshold in each group versus time.
