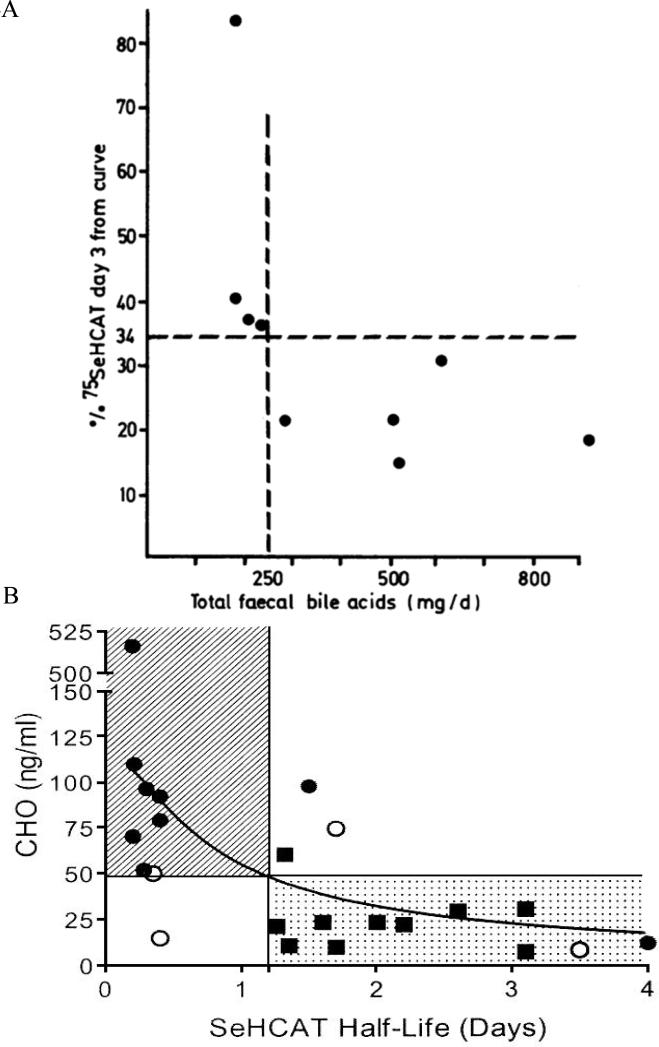
Figure 4A and B.
(A) 75SeHCAT values and total fecal bile acids of nine patients. Vertical dotted line marks the lower normal limit for total fecal bile acids (250mg/day). Reproduced from Sciaretta G, et al. Gut 1987;28:970-975. (B) Relationship between half-life of 75SeHCAT and HCO (7 α-hydroxy-4-cholesten-3-one) serum concentrations in patients with diarrhea of unknown origin. The response to treatment is indicated by different symbols (  = response to treatment, ■ = no response to treatment, ● = response not evaluated). The hatched area denotes pathologic values for both tests; the dotted area denotes normal values for both tests. Reproduced from Sauter GH, et al. Dig Dis Sci 1999;44:14-19.

