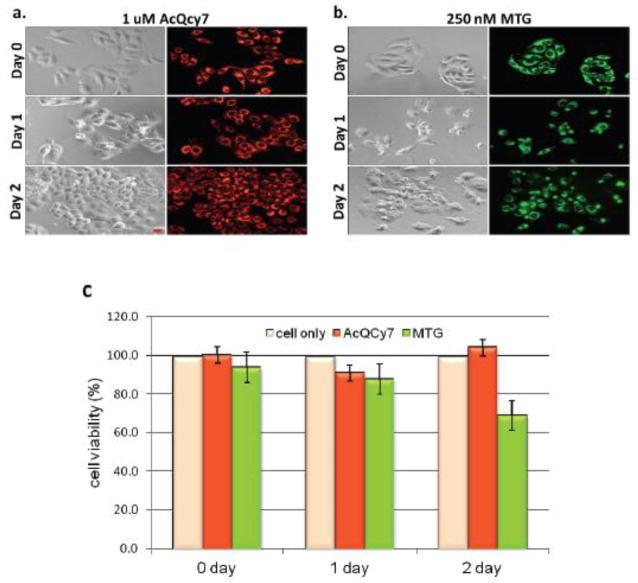
Fig. 3.
Cell toxicity of AcQCy7 or MTG studied by real-time fluorescence imaging of (a) AcQCy7-treated, (b) MTG-treated HeLa cells and (c) quantitative MTS assays. The left and right panel in figure a and b are the bright field and fluorescence images respectively. The cells were treated with either AcQCy7 (1 μM) or MTG (250 nM) for 30 min and then cultured with fresh complete media until fluorescent imaging or the MTS assay. Scale bar = 20 μm.

