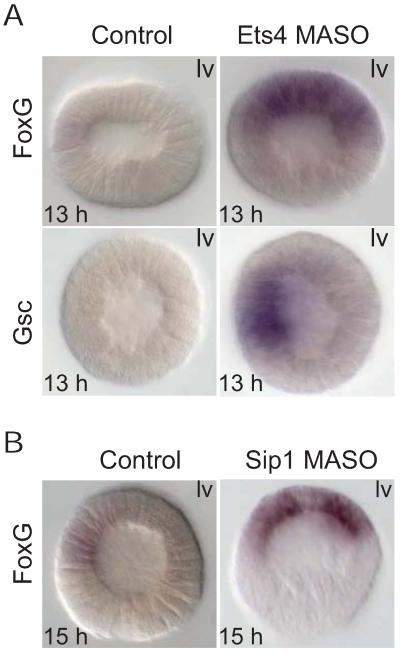
Figure 8.
Spatial effects of ets4 and sip1 MASOs. A) ets4 MASO. Transcripts of foxg and gsc were detected at early blastula stage (13 h) in embryos bearing ets4 MASO, but not in control embryos. Expression of gsc is still restricted to the oral ectoderm in ets4 morphants, but expression of foxg covers the whole ectoderm. B) sip1 MASO. Expression of foxg in sip1 morphants covers the oral and aboral ectoderm at the mid-blastula stage (15 hpf), similar to (A). lv—lateral view; av—apical view. All embryos were shown with the oral ectoderm facing left.

