
Figure 1. Cre-GFP expression and activity in tooth.
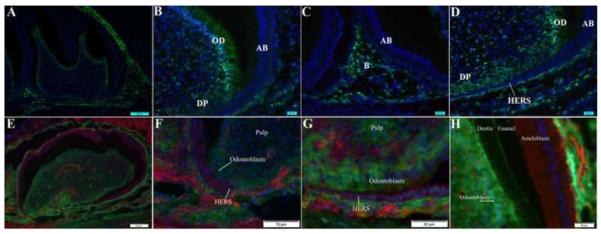
Cre expression was detected as green fluorescence in cryosections from P5 Cre+;Tgfbr2loxP/wt mice (A–D). Nuclei in the sections were counterstained with DAPI (blue). Cre-GFP was detected in dental mesenchyme including mature odontoblasts (B, D; OD), and some of the cells in the dental pulp (B, D; DP). Cre was also seen in the alveolar bone (C; B). GFP staining was not detected in cells of epithelial origin including ameloblasts (A–D, AB), or the HERS (D; small arrow). Low magnification image is shown in (A). Lineage tracing of Osx-Cre activity up to P7 days was determined using Osx-Cre+; ROSA25mTmG reporter mice (E–H). Lineage tracing of Cre activity is shown as green membrane staining. Cells in which Cre was never active are shown with red membrane staining. Nuclei are blue. Cre activity was present in cells derived from dental mesenchyme including odontoblasts (F, G). Epithelial structures including the HERS stained red, indicating no Cre activity during the lifetime of those cells (F, G). In the crown, Cre activity was detected in odontoblasts whereas ameloblasts demonstrated no Cre activity and were stained red (H). Odontoblastic cell processes in the dentin were outlined with GFP fluorescence (H). A low magnification image of the first molar from a P7 Osx-Cre+; ROSA25mTmG mouse is shown in (E).