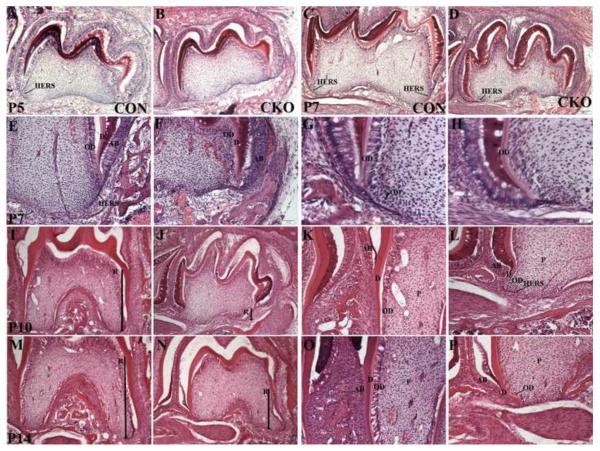
Figure 3. Comparison of tooth histology.
Representative images of H&E stained mandibular first molar from postnatal day (P) 5 (A, B), 7 (C–H), 10 (I–L) and 14 (M–P) Tgfbr2cko (CKO; A, C, E, G, I, K, M, O) and control (CON; B, D, F, H, J, L, N, P) mice. 100× (A–F, I, J, N, N) and 200× (K, L, O, P) and 400× (G, H) images from sagittal sections are shown. The second molar is to the left in all images. R- root length designated by thick arrow; OD- odontoblast; D- Dentin; AB- Ameloblasts; P- Dental pulp. Tgfbr2cko mice demonstrate alterations in the histology of odontoblasts and HERS. Representative images from three separate control and mutant mice are shown.

