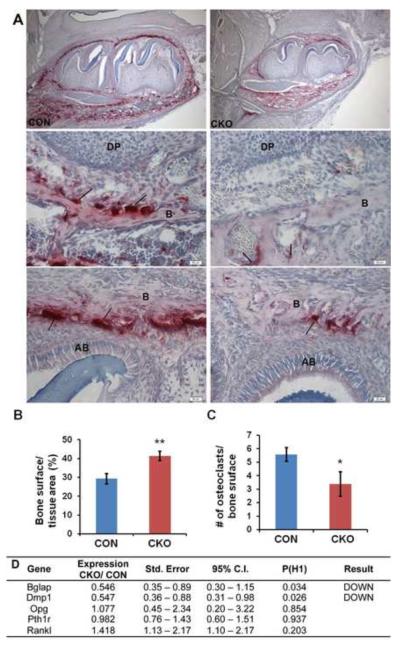
Figure 7. Osteoclast number is reduced in bone from Tgfbr2cko mice.
(A) Representative TRAP-stained images of mandibular sections from P7 control (CON; left) and Tgfbr2cko (CKO; right) mice. The top panels show the whole tooth and surrounding bone. The middle panels show alveolar bone near the root apex. The bottom panels are images of bone at the tooth crown. Magnification: 100× (top) and 400× (middle and bottom). Histomorphometry was used to evaluate (B) bone surface per bone area at the crown and (C) osteoclast number per unit bone surface at the crown. N = 3; *: P < 0.05; **: P < 0.01. Fewer TRAP-stained cells were seen in Tgfbr2cko mice. (D) Expression of osteoblast markers and factors that regulate osteoclast formation in bone. RNA was isolated from alveolar bone of P14 day control (CON) and Tgfbr2cko (CKO) mice. Quantitative real time RT-PCR was used to determine the relative levels of osteoblast differentiation markers and osteoclast regulators in the samples.

