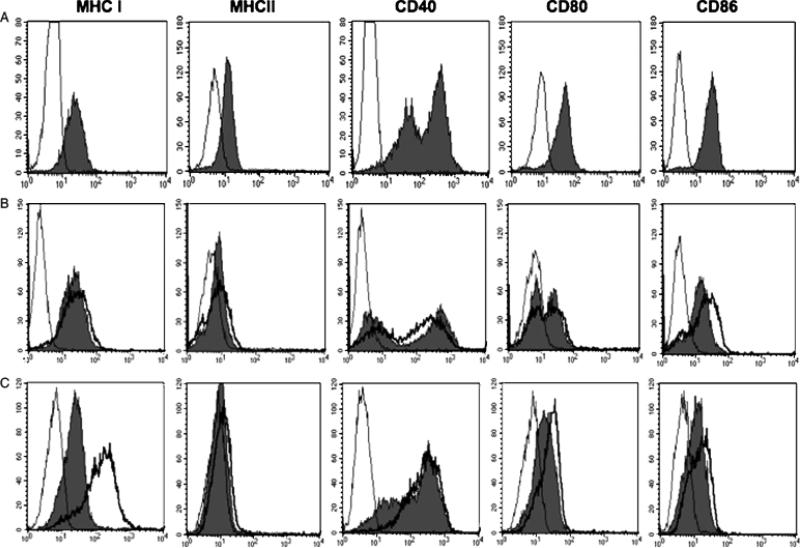
Fig. 2.
Fluorescent-activated cell sorting (FACS) analysis of antigen-presenting cell (APC) surface markers on the cultured cholangiocyte cell line. (A) The cultured cholangiocyte cell line was incubated with fluorescein isothiocyanate-labelled antibodies to major histocompatibility complex (MHC) I, MHC II, CD40, CD80 or CD86 followed by FACS analysis that revealed cell surface expression of all APC markers (solid grey) compared with isotype controls (thin black line). (B) Cultured cholangiocytes infected with RRV (multiplicity of infection of 50, 24 h) expressed higher levels of CD86 (heavy black line) compared with uninfected controls (solid grey) and isotype controls (thin black line). (C) Cultured cholangiocytes treated with interferon-γ and tumour necrosis factor-α showed marked increase in MHC I expression (heavy black line) compared with uninfected controls (solid grey) and isotype controls (thin black line).

