Figure 2.

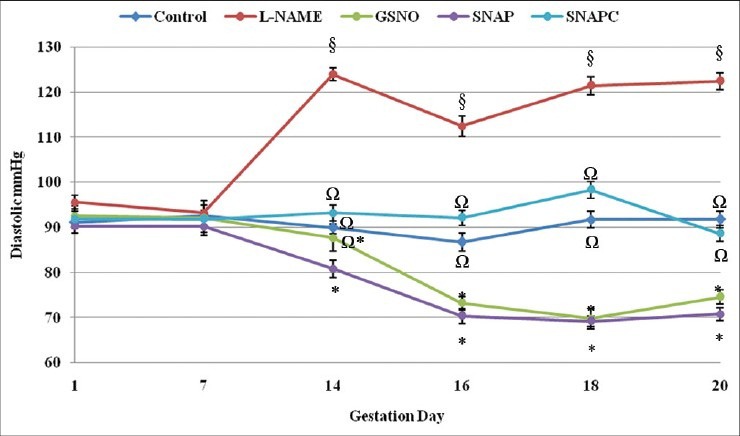
Diastolic pressure of the different groups from day 1 through to day 20 of gestation. Significant differences (P < 0.05) are indicated by different symbols on the different gestation days

Diastolic pressure of the different groups from day 1 through to day 20 of gestation. Significant differences (P < 0.05) are indicated by different symbols on the different gestation days