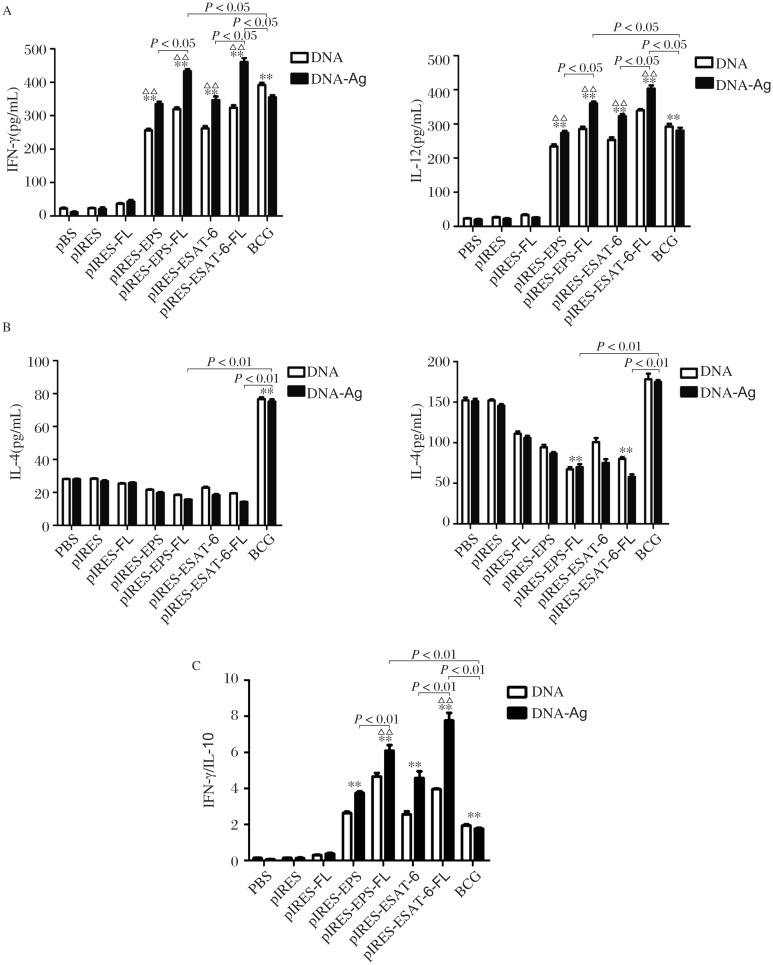
Fig. 3. Th1 immune responses of mice immunized with different plasmids.
The concentrations of Th1/Th2 cytokines in the culture supernatant of splenocyte from the mice were measured by ELISA. The levels of IFN-γ and IL-12 represented Th1 immune response A: while levels of IL-4 and IL-10 standed for Th2 immune response B: The ratio of IFN-γ/IL-10 was calculated to indicate Th1/Th2 reaction (C). **P < 0.01, indicating the levels of these cytokines in corresponding mice were markedly increased compared with those of the mice treated with PBS, pIRES or pIRES-FL; ΔΔP < 0.01, indicating the levels of these cytokines in the mice of DNA/Ags group significantly higher than those of the mice with other corresponding DNA treatment. Other difference (such as lower than the BCG group) between the groups are presented in the figure directly. Data are shown as mean ± SEM (n = 10), done in triplicate.

