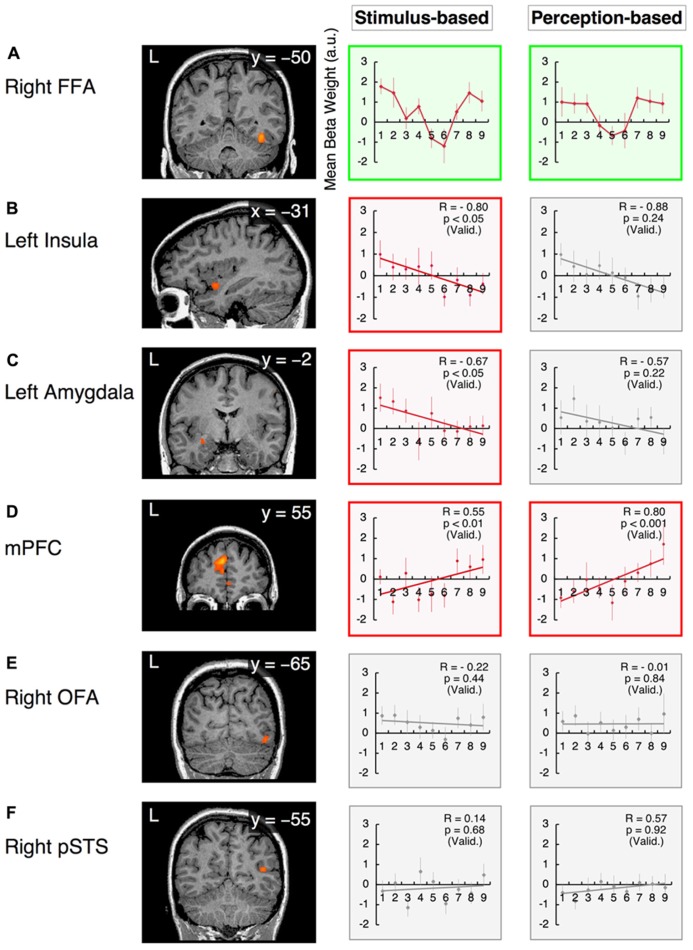
FIGURE 6.
Functional magnetic resonance imaging results in the valence dimension. The x-values represent morphed faces on the happiness - fear continuum depicted in Figure 2A, ranging from “1” = “0% happiness” to “9” = “100% happiness.” The y-values represent the BOLD signals [with arbitrary units (a.u.)] obtained from each ROI. Two graphs are provided for each ROI to indicate the results from the stimulus-based and perception-based analyses; in the latter analysis, each individual’s fMRI data are realigned in accordance with the individual’s behavioral data with respect to category boundaries (Table 1). The graphs in green squares represent U-shaped or categorical processing that differs from linear or constant processing. Graphs in red squares represent dimensional (linear) processing with statistically significant correlations after the subject-wise validation (Table 3). Graphs in gray squares represent constant processing without statistically significant correlations. Error bars denote SEM. R: the group-wise correlation coefficient. p (Valid.): the probability after the subject-wise validation (Table 3). (A) The right fusiform face area (FFA); (B) the left insula; (C) the left amygdala; (D) the mPFC; (E) the right OFA; and (F) the posterior STS (pSTS) in the right hemisphere.

