
Figure 2.
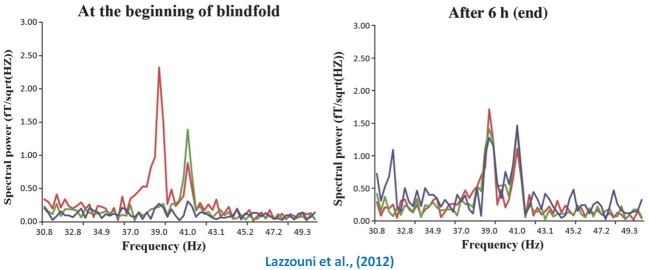
Crossmodal plasticity in temporarily deprived sighted individuals. This figure portrays a recent MEG finding that testifies to the impressive speed at which the visual cortex can display auditory cortex-like functioning following a short period of visual deprivation. The left graph shows that prior to blindfolding the two spectral peaks (left temporal in red; right temporal in green) associated with modulation rate of the auditory stimuli presented to both ears (39 and 41 Hz) are clearly restricted to the temporal electrodes (auditory cortex). However, as shown in the right graph, the same peaks can now be found in visual cortex (purple peaks) following a 6 h visual deprivation period. Adapted with permission from Lazzouni et al. (2012).