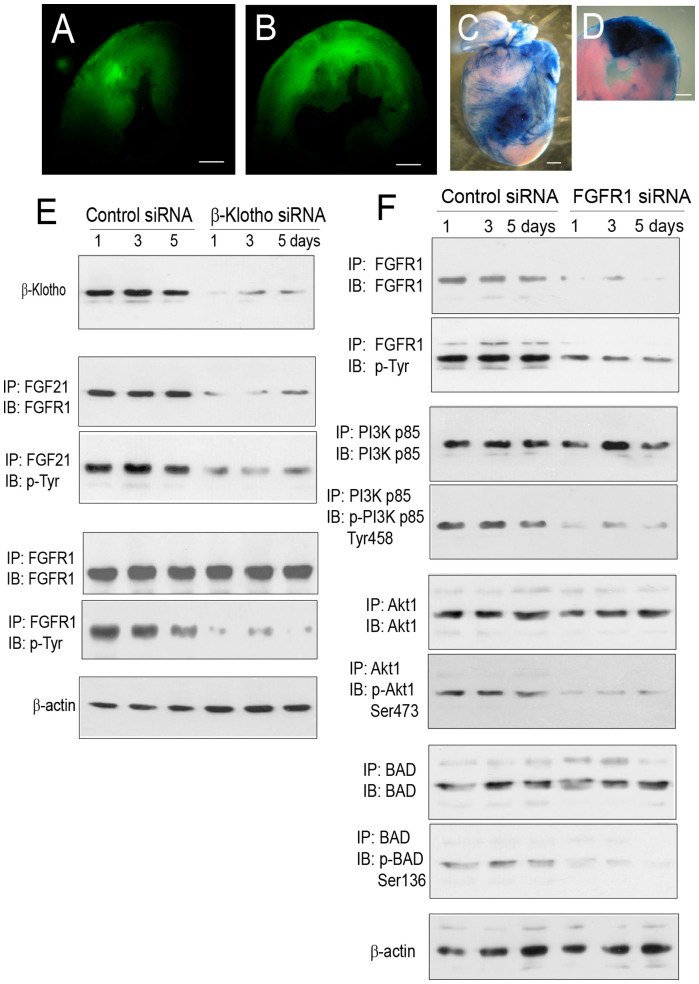
Figure 3. Influence of siRNA-mediated gene silencing on β-Klotho and FGFR1 signaling in cardiomyocytes.
(A, B) Fluorescence micrographs of left ventricular (LV) sections showing the distribution and coverage of a FITC-conjugated control siRNA in the myocardium at 1 hr following a single injection (panel A) or 6 equally spaced injections (5 μg/ml, 10 μl for each injection, ~0.5 mm in depth, ~2 mm apart, 2 columns) (panel B) into the left ventricular wall of a beating heart by thoracotomy. Scale bars: 1 mm. (C) The anterior view of a mouse heart showing the distribution of Evans blue immediately following a single injection into the left ventricular wall of a beating heart. Scale bar: 1 mm. (D) A LV slice from the heart shown in panel C demonstrating the distribution of Evans blue within the myocardium. Scale bar: 1 mm. (E) Influence of siRNA-mediated β-Klotho gene silencing on the relative expression of β-Klotho, co-immunoprecipitation of FGFR1 with FGF21, and the relative phosphorylation of FGFR1 in cardiomyocytes isolated from wild-type mice with myocardial injection of a β-Klotho or control siRNA. Myocardial ischemia/reperfusion injury was induced at 3 days after siRNA injection. Immunoprecipitation (IP) and immunoblot (IB) tests were carried out at 1, 3, and 5 days after myocardial injury. (F) Influence of siRNA-mediated FGFR1 gene silencing on the relative expression and phosphorylation of FGFR1, PI3K p85, Akt1, and BAD in cardiomyocytes isolated from wild-type mice with myocardial injection of a FGFR1 or control siRNA. The same protocol was used for the induction of myocardial injury and IP/IB tests. Note that cropped gel images are used in this figure and the gels were run under the same experimental conditions.

