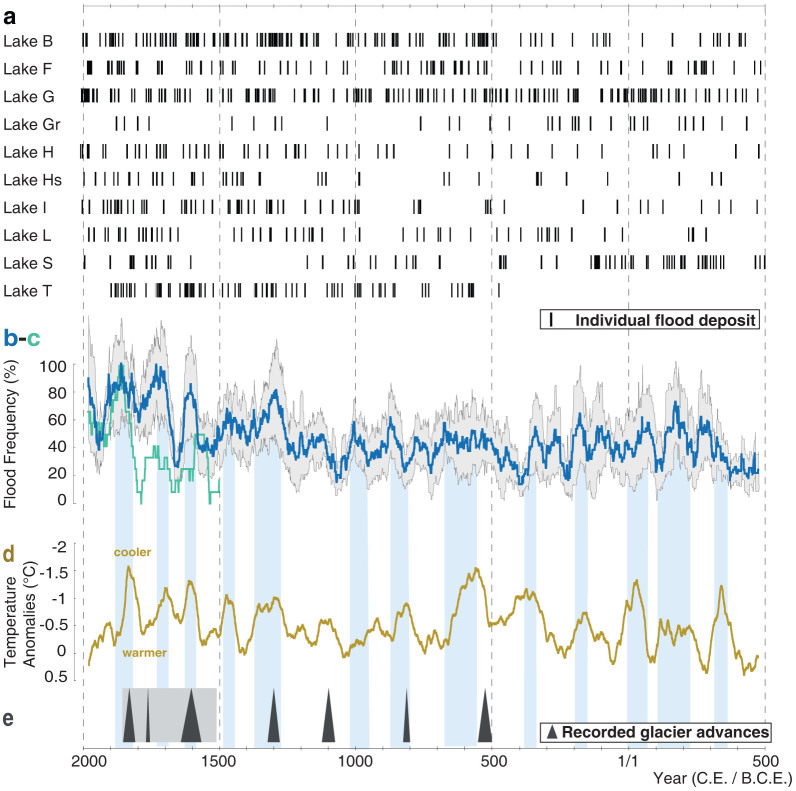
Figure 3. Alpine flood reconstruction.
(a), Flood chronologies of the ten studied lakes. Bars represent individual dated flood deposits. (b), Combination of the ten individual lake records represented as a 50-year moving average of flood events. The resulting frequency values are normalized between no flood activity (0%) and the maximal value (100%). The standard deviation is indicated with grey bars. (c), Historical flood reconstruction from Northern Switzerland (50-year moving average, normalized between 0 and 100%)8. (d), Tree-ring-based Central European summer temperature reconstruction (50-year moving average)21. (e), Major glacial advances reconstructed from the Lower Grindelwald Glacier (Northern Switzerland) indicated with triangles22; grey area marks period of large Alpine glacial extension22. Blue shaded bars indicate periods of high flood frequency that correlate with lower summer temperatures.

