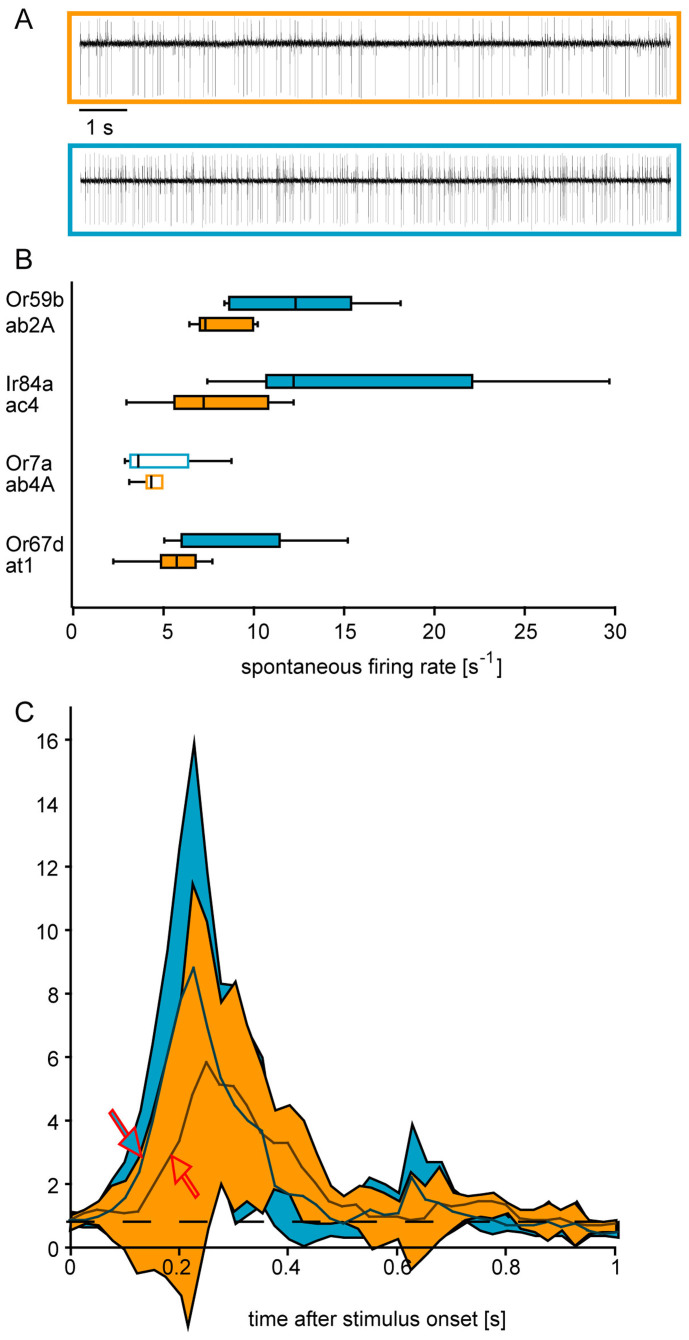
Figure 3. Spontaneous firing rate and response latencies of OSNs in starved and fed flies.
A. Examples of spontaneous spike traces from OSNs housed in sensillum ab2. B. Starvation-induced changes in spike frequencies of different OSNs. C. Mean normalized response profile of OSNs in 10 ab2A sensilla to 500 ms pulses of ethyl acetate (diluted 10−7 in paraffin oil). Average firing rate before the stimulus was set as 1. Firing rates after the stimulus were normalized accordingly. Arrows indicate where the response becomes significantly higher than before the stimulus (Wilcoxon signed ranks test, N = 10, p < 0.05, Lines, average response; shaded areas, standard deviation). Orange: fed flies; blue: starved flies.

