Abstract
We detected land displacements of Venice by Persistent Scatterer Interferometry using ERS and ENVISAT C-band and TerraSAR-X and COSMO-SkyMed X-band acquisitions over the periods 1992–2010 and 2008–2011, respectively. By reason of the larger observation period, the C-band sensors was used to quantify the long-term movements, i.e. the subsidence component primarily ascribed to natural processes. The high resolution X-band satellites reveal a high effectiveness to monitor short-time movements as those induced by human activities. Interpolation of the two datasets and removal of the C-band from the X-band map allows discriminating between the natural and anthropogenic components of the subsidence. A certain variability characterizes the natural subsidence (0.9 ± 0.7 mm/yr), mainly because of the heterogeneous nature and age of the lagoon subsoil. The 2008 displacements show that man interventions are responsible for movements ranging from −10 to 2 mm/yr. These displacements are generally local and distributed along the margins of the city islands.
The subsidence of Venice, one of the most beautiful and famous cities in the world, is well known not by reason of the magnitude of the ground movement but because it has seriously compromised the heritage and the safety of the city in relation of its small elevation above the sea.
Depending on the time span considered, different rates of the geological subsidence of the Venice area, generally ranging from 0.6 to 1.6 mm/yr, have been assessed by various authors1,2,3,4,5,6,7,8 using sediment core data and archaeological remains. During historical time, the loss in elevation of Venice was particularly severe in the last century, ~ 25 cm, i.e. 15 cm of subsidence mainly due to groundwater pumping in the nearby industrial area and 10 cm of eustacy. Subsidence and eustacy has both contributed to the loss of land elevation with respect to the mean sea level (or relative sea level rise, RSLR). Its quantification in Venice was obtained through various methodologies and not uniquely quantified9,10,11,12,13.
Considering the IPCC (International Panel on Climate Changes) mid-range A1B scenario and the recent land subsidence, the RSLR is expected to range between 17 and 53 cm by 210012. This means that the ground elevation of the historical center, which emerges only 90 cm above the mean sea, will be drastically reduced and consequently the frequency of “acqua alta” events, i.e. tides higher than 110 cm, will increase from the nowadays 4 times per year to a range between 20 and 25012. In order to protect the city and its lagoon environment from increased flooding, the multi-billion euro MOSE project is under construction since early 2000s. It consists of rows of mobile gates that will close the inlets connecting the lagoon to the Adriatic Sea when tide events higher than 110 cm are predicted. Large new structures have been already built and inlet jetties reshaped. Some works are located only 4 km far from the eastern tip of Venice.
During the last two decades, satellites instrumented with SAR (Synthetic Aperture Radar) sensors provided excellent data for detecting land displacements by interferometric processing. The use of this methodology opens new possibilities for a more accurate interpretation of the land subsidence. The first SAR analysis on Venice was carried out by DInSAR (Differential Interferometric SAR) and provided thousands of measurements much more than the few hundred benchmarks previously used by leveling14. More recently the application of Persistent Scatterer Interferometry (PSI)15,16 on C-band satellites has remarkably increased the number of measurable targets, achieving accuracies comparable to that of leveling and permanent GPS. PSI has progressively reduced the use of in-situ traditional techniques to the calibration of the SAR-based methodologies17,18,19. An accurate quantification of the relative and differential movements of single churches, palaces, bridges has become possible with the launch of the new generation X-band sensors characterized by a higher spatial resolution and a shorter revisiting time than C-band. For instance at Venice, the settlement of the MOSE coastal infrastructures, locally up to −70 mm/yr, does not affect the historical center20,21,22.
Although the effect of groundwater pumping ended a few decades ago, a reliable and detail knowledge of the land subsidence affecting the historical center is even more important today due to the city vulnerability continuously increased over the years.
This work is aimed at distinguishing between natural land subsidence and movements induced by anthropogenic activities at Venice using the long- and short-term displacements of the historical center obtained by PSI on C- and X-band images, respectively. PSI provides the cumulative land displacements (natural plus anthropogenic) of the investigated area independently of the radar band. The natural subsidence rate depends on the reference period and, due to the present elevation of Venice with respect to the sea level, it is much more interesting to evaluate the natural displacement over the last few decades, i.e. the present natural land subsidence, than that averaged over geological periods. Concerning anthropogenic land subsidence the contribution due to activities characterized by large scale and long term effects, e.g., that caused by groundwater withdrawals, ended a few decades ago12,18. Today, the anthropogenic component of the land subsidence is only due to local, short-time interventions such as restoration works and inherent deformations of historical structures.
Based on these considerations the PSI outcomes are processed to distinguish between the two components of the present land subsidence of Venice. The longest time analysis (C-band dataset) are reasonably used for quantifying the natural component and the shortest analysis (X-band dataset) for highlighting the anthropogenic displacements. The higher pixel resolution of the X-band data enhances the detection of small-scale movements.
Results
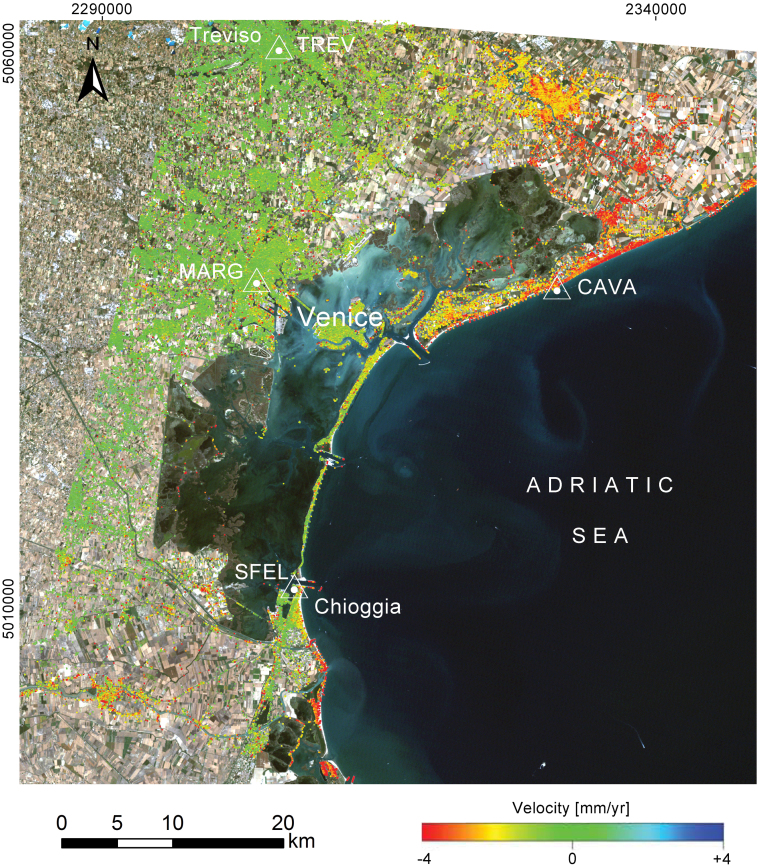
Twenty years of C-band SAR acquisitions, i.e. 1992–2002 for ERS and 2003–2010 for ENVISAT, provided a detailed image of land subsidence at the Venice coastland. The results highlight an almost stable (±1 mm/yr) area encompassing the cities of Treviso, Venice and Chioggia and a zone with significant sinking rates (3–6 mm/yr) in the northern coastland. A large variability (from −4 to 1 mm/yr) characterizes the southern coastland (Fig. 1).
Figure 1. Velocity map (mm/yr) for the Venice coastland obtained by IPTA on ENVISAT images acquired between 2003 and 2010.
Positive values mean uplift, negative land subsidence. White triangles show the position of the permanent GPS stations (CGPS). Base map used is a Landsat image obtained from the US Geological Survey – Earth Resources Observation and Science (EROS) Center and composed in ESRI ArcMAP 9.3.
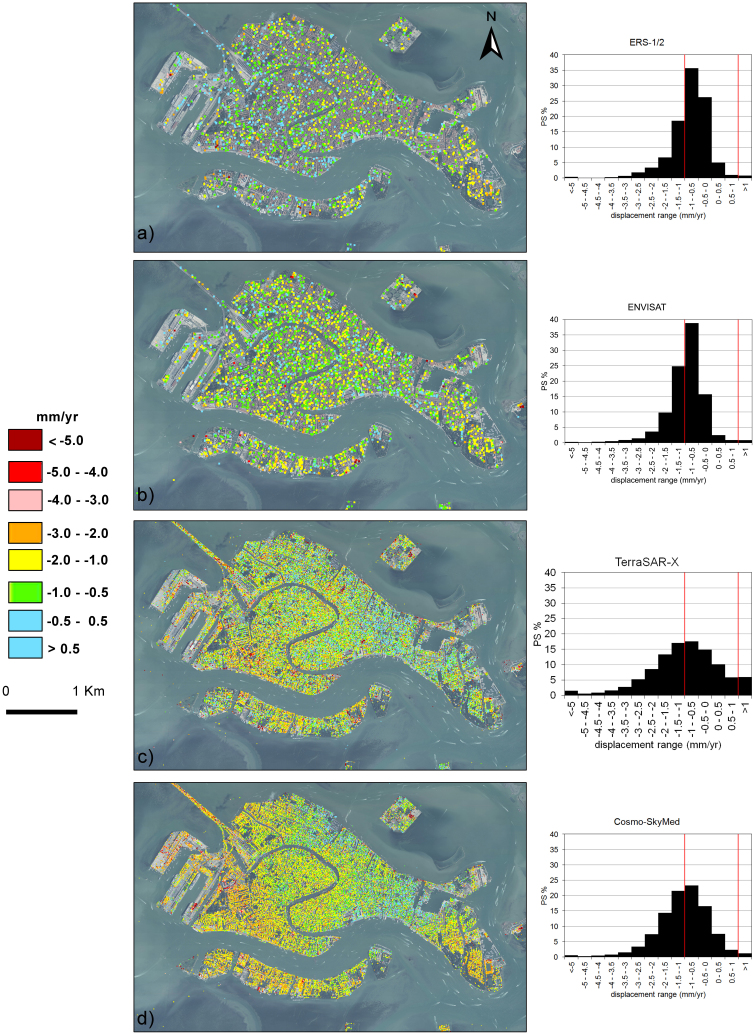
Focusing on the historical center of Venice, the displacement pictures of the city over the two consecutive periods covered by C-band images are comparable and characterized by a small variability (Fig. 2a and b). The mean subsidence rate and the standard deviation amount to 0.8 ± 0.7 and 1.0 ± 0.7 mm/yr with ERS and ENVISAT, respectively. Note that the standard deviations are representative of the ground motion variability at the whole city scale and not related to the uncertainty of the velocity of the radar reflectors (i.e. measurement accuracy). On the average the C-band measurements show that about 80–85% of the city displacements range between 0 and −1.5 mm/yr and 15% from −1.5 to −3 mm/yr. Taking into account that PSI requires a coherent target response in the whole image dataset, i.e. a radar reflector must rest on the soil over the entire monitoring period and cannot experienced abrupt movements to be measurable23,24, this long-term map can be interpreted as a reliable picture of the natural subsidence that is presently affecting Venice.
Figure 2.
Average displacement rates (mm/yr) obtained by IPTA at Venice: (a) ERS from 1992 to 2002; (b) ENVISAT from 2003 to 2010; (c) TerraSAR-X from March 2008 and January 2009; (d) COSMO-SkyMed from 2008 to 2011. The image background is an aerophotograph acquired in 2009. Negative values indicate settlement, positive mean uplift. The frequency distribution of the displacements for each map is provided to the right. The red lines separate the subsiding (<−1 mm/yr), stable (between −1 and 1 mm/yr), and uplifiting (>1 mm/yr) portions. Figure composed in ESRI ArcMAP 9.3.
The very high spatial resolution of the X-band satellites and their short revisiting time makes it possible to investigate urban settlements with a level of detail never obtained in the past. Although the number of available TerraSAR-X and COSMO-SkyMed scenes is equivalent, they cover 11 months (from March 2008 to January 2009 for TerraSAR-X) and 35 months (form September 2008 to July 2011 for Cosmo-SkyMed), with different sampling rates. The PSI outcomes (Fig. 2c and d) show a density of the detected scatters one order of magnitude larger than that obtained by the C-band sensors. The statistical analysis of the displacement distributions points out that the average rates are almost equal with the two satellites, i.e. −1.0 mm/yr with TerraSAR-X and −1.1 with COSMO-SkyMed, and also quite similar to those detected by C-band satellites. The standard deviation is characterized by significant larger values equal to 1.6 and 1.0 mm/yr with TerraSAR-X and COSMO-SkyMed, respectively. The frequency distribution of the measured displacements shows that 50% and 60% of the radar reflectors are characterized by a movement between 0 and −1.5 mm/yr for TerraSAR-X and COSMO-SkyMed, respectively, and 25% range from −1.5 and −3.0 mm/yr for both the X-band sensors.
The higher variability of the displacements obtained by the X-band scenes, in particular TerraSAR-X, is an added value of the short-term analysis combined with the satellite characteristics, i.e. a small revisiting time and the 2-m pixel spacing. As C- and X-band analyses show similar rates of the average displacement, i.e. the natural component of the subsidence, it is reasonable to assume that the difference between the movements provided by ERS/ENVISAT and TerraSAR-X/COSMO-SkyMed is likely representative of the effects caused by anthropogenic activities.
This hypothesis is supported by a proper processing of the two C- and X-band measurements. The two datasets are interpolated by the Kriging method on the same regular grid covering the whole city. The grid spacing, fixed at 50 m, has been appropriately tuned to simultaneously:
filter out the outlier values provided by the C-band analysis; these outliers are referred to a few (~5%) unstable targets, generally due to human effects, scattered within the majority of the solution representing the natural processes;
keep the heterogeneity of the displacements detected by the X-band investigation.
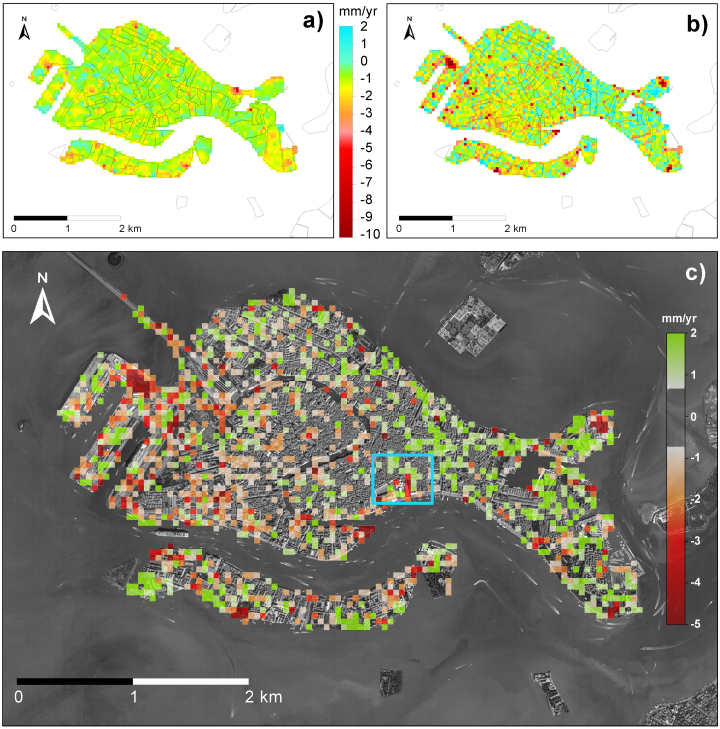
Finally the quantification of man-induced displacements is obtained by removing the C-band interpolated map from the X-band interpolated solution. This procedure has been applied to the 1992–2010 mean velocities provided by ERS/ENVISAT (Fig. 3a) and to 2008 TerraSAR-X results (Fig. 3b). This latter has been preferred to COSMO-SkyMed because of i) the higher ratio between the number of available images and the acquisition period, ii) the shorter acquisition period and its fall within the monitoring interval covered by the C-band images, and iii) the better quality of the PSI outcome due to the variability (from 16 to 144 days) of two consecutive COSMO-SkyMed acquisitions. Notice that the ~ 1-year long dataset from TerraSAR-X is sufficient to filter out possible cyclical fluctuations, if any, due to season climate effects (e.g., precipitation, aquifer recharge, temperature, tidal regime).
Figure 3.
Maps of the displacement rate (positive velocities indicate site uplift, negative velocities indicate land subsidence) obtained by interpolating: (a) the ERS-ENVISAT and (b) the TerraSAR-X IPTA results on a regular 50 m grid. (c) Difference between the TerraSAR-X and ERS-ENVISAT maps representing an estimate of the present anthropogenic land movements at Venice. Negative and positive rates indicate areas where human activities are responsible for land settlements or reduce the natural subsidence, respectively. The light-blue box in (c) refers to the area investigated in Fig. 5. Maps composed in Golden Software Surfer 10.
The comparison between the two maps obtained by interpolating the PSI results points out the uniformity (in the range between 0 and −1 mm/yr) of the long-term displacement rates (Fig. 3a) and the large variability of the short-term movements (Fig. 3b) that are superposed to a background velocity similar to that given by ERS/ENVISAT (Fig. 3a). The map of the differences (Fig. 3c) shows that most of the city is subsiding only due to natural components. However, about 25% of city has experienced in 2008 some movements due to anthropogenic causes. Generally, the man-induced activities contribute to a subsidence larger than the natural (15%) but there are some areas (10%) where the short-term sinking is smaller than the long-term subsidence.
Discussion
Venice is no more subsiding due to groundwater pumping. However, the peculiarly of the city position, located above about 1000 m thick Quaternary deposits, and the structure of the historical center, which is funded by wooden piles established on sand-clay layers and artificial reclamations of tidal flats and channels, require to continue the monitoring of the city displacements. The use of C- and X-band sensors has allowed quantifying the natural and man-induced components of the present land subsidence.
The “present natural” subsidence rate of the “historical center of Venice” averages 0.8–1.0 mm/yr consistently with the “geological” subsidence of the “Venice area” of ~ 1.3 mm/yr2,5 and ~ 0.6 mm/yr25.
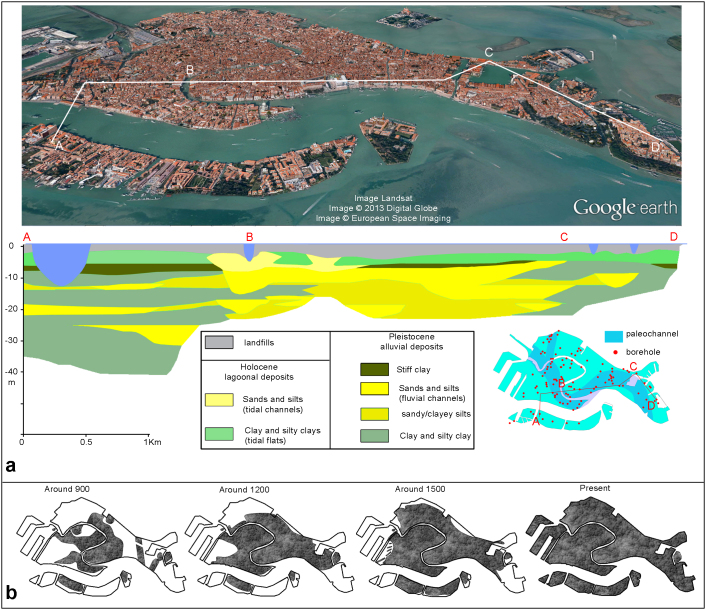
However, because geological subsidence was estimated at least at Kyr scale, it is not representative of the present natural subsidence of the entire city. Local zones and restricted portions are subsiding at faster rates, i.e. 1–3 mm/yr, due the heterogeneous nature of the shallow subsoil, i.e. natural or landfill (Fig. 4a), growth of the city (Fig. 4b), and different depth of foundation and load of the historical palaces. An even more large variability of the present natural subsidence has been recently detected in the nearby Po River delta26.
Figure 4.
(a) Architecture of the shallow subsoil of Venice along the alignment A–D. The location of the geological data is shown in the inset27. The satellite image is from Google Earth, data source: Landsat, 2013 Digital Globe, and European Space Imaging. (b) Growth in area of Venice from 900 A.D. to present.
In particular, the occurrence of buried sandy levees of channel systems (perhaps the primeval Canal Grande27) well corresponds with the sectors of the city characterized by smaller settlements. Conversely, zones established on more compressible silty and clayey alluvial and tidal plain deposits sink at higher rates (Fig. 4a). Also the age of the landfills, i.e. the growth of the primeval island of Venice and the buildup of historical center, is correlated with the subsidence variability14. The city developed over ancient well-consolidated sandy islands during the first millennium, and the following expansions were done by reclaiming and filling parts of the lagoon tidal flats and channels (Fig. 4b). The older part of the city, which generally corresponds with the city extension before 1500, shows lower sinking rates or quite stable sectors.
The present anthropogenic displacements occur at very local scale and are heterogeneously distributed with values ranging from −10 and 2 mm/yr in 2008. They are caused by conservation and reconstruction processes to preserve the building heritage (Fig. 5) together with urban maintenance activities such as restoring the embankment walls to guarantee the stability of the canal edges. Moreover, because the sinking zones are generally concentrated along the main channels bounding and crossing the city (Fig. 3c), waves induced by the intensive boat and ship traffic likely contribute by waking and eroding the fragile masonry canal banks and the building foundations28. Geotechnical applications such as micropiles, anchors, jet grouting aimed at improving the subsoil characteristics are likely responsible for the greater stability locally observed in some portions of the city as of 2008 (Fig. 3c).
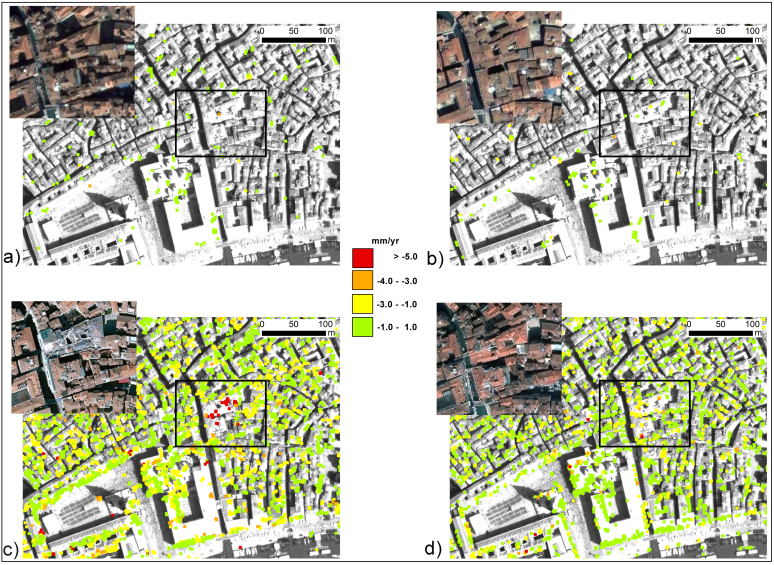
Figure 5. Example of temporary high sinking rates due to restoration works of single palaces.
Average displacement rates (mm/yr) obtained by IPTA at a portion of the city NE of St. Mark's Basilica: (a) ERS, (b) ENVISAT, (c) TerraSAR-X, and (d) COSMO-SkyMed. The picture comparison highlights how the short-term analysis performed with the TerraSAR-X images (c) captures the effect of the works carried out in 2007 (see the corresponding aerial photograph shown in the inset). The longer time series acquired by C-band sensors (a and b) show that before 2007 the area was affected by the natural subsidence only (~1 mm/yr). After the end of the works, the average rates reduce following the consolidation process, as detected by COSMO-SkyMed. Figure composed in ESRI ArcMAP 9.3.
The following conclusions are worth summarizing: a) the combined use of long-term C-band and short-term X-band SAR investigations offers a unique opportunity to discriminate between natural and anthropogenic land subsidence; b) the present average natural subsidence of Venice has been quantified in 0.8–1.0 mm/yr, a value which is in agreement with the average rate calculated for the geological subsidence at Kyr scale. Moreover, a certain variability has been detected and correlated with the characteristics of the shallow subsoil and the growth of the historical center; c) Venice is still experiencing land subsidence due to human activities, mainly restoration works. However this component affects the city at very local scale for short time intervals with rates up to 10 mm/yr.
Methods
The Interferometric Point Target Analysis (IPTA)16,29, a Persistent Scatterer Interferometry (PSI)15 implementation chain, is applied on stripmap images acquired by C-band (ERS, ENVISAT) and X-band (TerraSAR-X, COSMO-SkyMed) satellites. IPTA combines data from SAR images acquired from repeat track orbits to exploit the phase differences of the radar signals that are related only to surface displacement occurring between the image acquisitions. IPTA systematically removes the contribution of surface topography to the interferometric phase and mitigates the variability in the tropospheric path delay by utilizing differences in the spatial and temporal characteristics of the phase due to deformation and atmosphere. IPTA-derived deformation measurements are interpreted for a number of point radar-bright and radar-phase-stable targets (PTs) that are coherent over the entire time interval and cover the monitored area as a sparse “natural” benchmark net29.
C-band and X-band sensors have different features and are characterized by different revisiting time (Tab. 1). The images covering the study area were acquired regularly by the two C-band satellites and TerraSAR-X. A very variable time interval between two consecutive images characterizes the COSMO-SkyMed acquisitions, up to 144 days from February 23, 2011, and 3 July 17, 2011.
Table 1. Characteristics of the satellites sensors and SAR images. ERS-1/2 and ENVISAT SAR data processed to same Doppler.
| Sensor | ERS-1/2 SAR | ENVISAT ASAR | TerraSAR-X | Cosmo-SkyMed |
|---|---|---|---|---|
| Band | C | C | X | X |
| MHz | 15 | 16 | 150 | 100 |
| Doppler range (Hz) | 250 | 200 | −180–62 | 600–800 |
| Nr. images | 73 | 72 | 30 | 31 |
| Time period (yy.mm.dd) | 1992.05.10–2003.12.03 | 2003.04.02–2010.09.22 | 2008.03.05–2009.01.29 | 2008.09.26–2011.07.17 |
| Ground pixel spacing in range and azimuth (m × m) | 20 × 4 | 20 × 4 | 2 × 2 | 2 × 2 |
| Nominal repeat cycle (days) | 35 | 35 | 11 | 16 |
| Central Reference Image (yy.mm.dd) | 1997.10.15 | 2004.12.22 | 2008.07.15 | 2010.01.19 |
| Baseline distribution (m – m) | −1863–1816 | −878—821 | −148–190 | −719–695 |
| Time Interval distribution (days – days) | −1984–2870 | −630–2100 | −132–198 | −480–545 |
| Incidence angle and polarization | 23° VV | 23° VV | 29° HH | 35° HH |
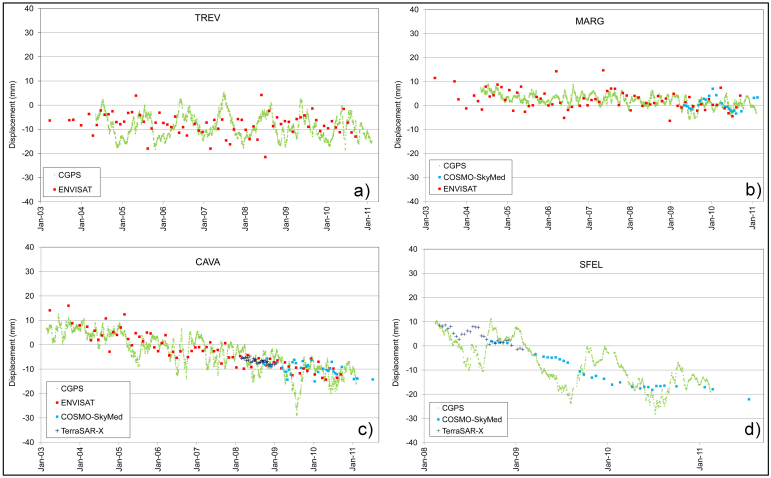
The selection of candidate point targets is based on a temporal mean-to-standard deviation ratio of the co-registered SAR intensity images29,20 above 1.4 for ERS, 1.25 for ENVISAT, 1.6 for TerraSAR-X, and 1.4 for COSMO-SkyMed and a spectral correlation averaged over the single look complex stack of more than 0.5 for both ERS and ENVISAT and of more than 0.4 for both TerraSAR-X and COSMO-SkyMed. Interferometric processing is performed on an ellipsoidal model without any digital elevation model, because the area is flat. An initial two-dimensional linear regression is applied on the candidate point targets to solve simultaneously for the height and deformation rate of a point relative to another point after solving the 2π phase ambiguity in the temporal domain. Only pairs of points with a regression standard deviation of less than 1.0 rad for ERS, 1.2 rad for ENVISAT, 0.65 rad for TerraSAR-X and 0.9 for COSMO-SkyMed are retained. Neighboring patches of the dimension of a couple of kilometers for ERS and ENVISAT, and a few hundreds of meters for TerraSAR-X and COSMO-SkyMed, respectively, are iteratively considered. After differential interferometry, phase unwrapping errors are corrected on the spatial domain using a minimum cost–flow algorithm for sparse data30. Then, with consideration of the initial height and deformation estimates, the residual phase images containing the atmospheric phase, nonlinear deformation, and error terms, are interpolated to the initial list of point targets and the two-dimensional linear regression with respect to height and deformation rate is performed again with respect to reference points near the Rialto Bridge. This iteration is repeated various times in order to include as many points as possible, because the quality of potential additional points can be evaluated more reliably if the improved model for the validated points is available. At the last stage, points with a regression standard deviation of less than 1.1 rad for ERS, 1.2 rad for ENVISAT, 1.3 rad for TerraSAR-X and 1.0 rad for COSMO-SkyMed are considered. The discrimination of atmospheric phase, nonlinear deformation, and error terms is based on their differing spatial and temporal dependencies17. The atmospheric path delay is assumed to be correlated on a spatial window of about 500 m size but independent from pass to pass. The nonlinear deformation is assumed in general to be spatially high-pass and temporally low-pass, with use of a 90 days filter for TerraSAR-X and of a 1000 days filter for ERS, ENVISAT and COSMO-SkyMed. The phase noise is random in both spatial and temporal dimensions. In order to correct the so-called flattening problem, i.e. the slight phase tilt resulting by the inaccuracy in estimation of the orbital baseline due to the not perfect knowledge of the satellite positions18,19,31,32,33, IPTA results have been calibrated using leveling and permanent GPS stations (CGPS)31,34 (Fig. 6).
Figure 6. Data validation.
Comparison between the displacement histories recorded by the (a) TREV, (b) MARG, (c) CAVA, (d) SFEL CGPS and those obtained by IPTA on the persistent reflectors in the nearby of the permanent stations.
IPTA provides land displacements along the line-of-sight (LOS) between the satellite and the targets. Due to the small incidence angle, LOS is less sensitive to the horizontal components. Thus the difference between the LOS and the vertical components of the movement (about 8% for ERS and ENVISAT and 13–18% for TerraSAR-X and COSMO-SkyMed) is neglected. Moreover, the occurrence of an E-W displacement, for example because of the tectonic deformation, would affect the SAR interferometry measurement. However, the network of the CGPS stations established by the Venice Water Authority and ASI (Fig. 1) (SOPAC, http://sopac.ucsd.edu) shows that the Venice coastland is moving in the horizontal direction almost uniformly: i) 16 and 21 mm/yr northward and eastward31, respectively, with reference to ITRF200035; ii) 18–20 mm/yr northward and 15–17 eastward32 with reference to ITRF 200536.
Author Contributions
T.S. performed IPTA analysis by GAMMA Software. L.T. and P.T. validated PS data by CGPS, processed and analyzed the outcomes, interpreted data and wrote the paper. All authors discussed and commented on the methods, results and the manuscript.
Acknowledgments
This work has been developed in the framework of the Action 2 (SP3-WP1) “Hydrogeology, subsidence and relative sea level changes” funded by the Flagship Project RITMARE - The Italian Research for the Sea - coordinated by the Italian National Research Council and funded by the Italian Ministry of Education, University and Research within the National Research Program 2011–2013. Data courtesy: (1) COSMO-SkyMed AO, Project ID 2100 © ASI “Land movements in the Venice Lagoon: measuring the natural/regional and anthropogenic/local components by SAR Interferometric Point Target Analysis (IPTA); (2) TerraSAR-X, Project COA0612 © DLR “Assessing vertical movements of natural tidal landforms and anthropogenic structures at the Venice Lagoon inlets” and (3) GPS and ENVISAT, INLET Project, funded by Magistrato alle Acque (Venice Water Authority) through its concessionary Consorzio Venezia Nuova. The authors thank Prof. Fulvio Zezza (IUAV University, Venice) for making available geological data and fruitful discussions.
References
- Fontes J. & Bortolami G. Subsidence of the Venice area during the past 40,000 yr. Nature 244, 339–341 (1977). [Google Scholar]
- Bortolami G. C., Fontes J. C., Markgraf V. & Saliege J. F. Land, sea and climate in the northern Adriatic region during late Pleistocene and Holocene. Palaeogeogr. Palaeoclimatol. Palaeoecol. 21, 139–156 (1977). [Google Scholar]
- Carminati E. & Di Donato G. Separating natural and anthropogenic vertical movements in fast subsiding areas: the Po plain (N. Italy) case. Geophys. Res. Lett. 26, 2291–2294 (1999). [Google Scholar]
- Kent V. D., Rio D., Massari F., Kukla G. & Lanci L. Emergence of Venice during the Pleistocene. Quat. Sci. Rev. 21, 1719–1727 (2002). [Google Scholar]
- Carminati E., Doglioni C. & Scrocca D. Apennines subduction-related subsidence of Venice. Geophys. Res. Lett. 30, 1717 (2003). [Google Scholar]
- Massari F. et al. The environment of Venice area in the past two million years. Palaeogeogr. Palaeoclimatol. Palaeoecol. 202, 273–308 (2004). [Google Scholar]
- Barbieri C. et al. Natural subsidence of the Venice area during the last 60 Myr. Basin Res. 19, 105–123 (2007). [Google Scholar]
- Antonioli F. et al. Holocene relative sea-level changes and vertical movements along the Italian and Istrian coastlines. Quatern. Int. 206, 102–133 (2009). [Google Scholar]
- Ammerman A. J. & McClennen C. E. Saving Venice. Science 289, 5483, 1301–1302 (2000). [DOI] [PubMed] [Google Scholar]
- Ammerman A. J., McClennen C. E., De Min M. & Housley R. Sea-level change and the archaeology of early Venice. Antiquity 73, 303–312 (1999). [Google Scholar]
- Camuffo D. & Sturaro G. Sixty-cm submersion of Venice discovered thanks to Canaletto's paintings. Climatic Change 58, 333–343 (2003). [Google Scholar]
- Carbognin L., Teatini P., Tomasin A. & Tosi L. Global change and relative sea level rise at Venice: What impact in term of flooding. Clim. Dyn. 35, 1039–1047 (2010). [Google Scholar]
- Lambeck K. et al. Sea level change alongthe Italian coast during the Holocene and projections for the future. Quatern. Int. 232, 250–257 (2011). [Google Scholar]
- Tosi L., Carbognin L., Teatini P., Strozzi T. & Wegmüller U. Evidence of the present relative land stability of Venice, Italy, from land, sea, and space observations. Geophys. Res. Lett. 29, 1562 (2012). [Google Scholar]
- Ferretti A., Prati C. & Rocca F. Permanent scatterers in SAR interferometry. IEEE Trans. Geosci. Remote Sens. 39, 8–20 (2001). [Google Scholar]
- Werner C., Wegmüller U., Strozzi T. & Wiesmann A. Interferometric Point Target Analysis for deformation mapping. Proceedings of the Geoscience and Remote Sensing Symposium (IGARSS 2003), IEEE International 7, 4362–4364 (2003). [Google Scholar]
- Teatini P. et al. Short- and long-time displacements in the Venice coastland by synthetic aperture radar interferometric point target analysis. J. Geophys. Res. 112, F01012 (2007). [Google Scholar]
- Tosi L. et al. Ground surface dynamics in the northern Adriatic coastland over the last two decades. Rend. Fis. Acc. Lincei 21, S115–S129 (2010). [Google Scholar]
- Teatini P. et al. Resolving land subsidence within the Venice Lagoon by persistent scatterer SAR interferometry. Phys. Chem. Earth. Pt. A/B/C 40, 72–79 (2012). [Google Scholar]
- Strozzi T., Teatini P. & Tosi L. TerraSAR-X reveals the impact of the mobile barrier works on Venice coastland stability. Remote Sens. Environ. 113, 2682–2688 (2009). [Google Scholar]
- Tosi L., Strozzi T. & Teatini P. COSMO-SkyMed versus TerraSAR-X-based interferometry for monitoring the mose settlements at the Venice lagoon inlets. Proceedings of the Geoscience and Remote Sensing Symposium (IGARSS 2012), IEEE International 2837–2840 (2012). [Google Scholar]
- Tosi L., Teatini P., Bincoletto L., Simonini P. & Strozzi T. Integrating geotechnical and interferometric SAR measurements for secondary compressibility characterization of coastal soils. Surv. Geophys. 33, 907–926 (2012). [Google Scholar]
- Crosetto M. et al. Validation of Persistent Scatterers Interferometry over a mining test site: results of the PSIC4 project. Proceedings of the Envisat Symposium 2007 ESA SP-636 (2007). [Google Scholar]
- Crosetto M. et al. Ground motion monitoring using SAR interferometry: quality assessment. European Geologist 26, 12–15 (2009). [Google Scholar]
- Antonioli F. et al. Relative sea-level rise and asymmetric subsidence in the northern Adriatic. Rendiconti online Soc. Geol. It. 9, 5–8 (2009). [Google Scholar]
- Teatini P., Tosi L. & Strozzi T. Quantitative evidence that compaction of Holocene sediments drives the present land subsidence of the Po Delta, Italy. J. Geophys. Res. 116, B08407 (2011). [Google Scholar]
- Zezza F. The sedimentary structure of Upper Pleistocene–Holocene deposits in Venice and its effects on the stability of the historic centre. Rend. Fis. Acc. Lincei 21, S211–S227 (2010). [Google Scholar]
- Doglioni F., Roberti G. M., Trovò F., Bondanelli M. & Squassina A. A structural damage atlas for Venice. Scientific Research and Safeguarding of Venice 6, 133–146 (2007). [Google Scholar]
- Wegmüller U., Werner C., Strozzi T. & Wiesmann A. Multitemporal interferometric point target analysis. Ser. Remote Sens. 3, 136−144 (2004). [Google Scholar]
- Werner C., Wegmüller U., Strozzi T. & Wiesmann A. Processing strategies for phase unwrapping for INSAR applications. Proceedings of the European Conference on Synthetic Aperture Radar (EUSAR 2002) 1, 353−356 (2002). [Google Scholar]
- Teatini P. et al. Mapping regional land displacements in the Venice coastland by an integrated monitoring system. Remote Sens. Environ. 98, 403–413 (2005). [Google Scholar]
- Bock Y., Wdowinski S., Ferretti A., Novali F. & Fumagalli A. Recent subsidence of the Venice Lagoon from continuous GPS and interferometric synthetic aperture radar. Geochem. Geophys. Geosyst. 13, Q03023 (2012). [Google Scholar]
- Teatini P., Tosi L. & Strozzi T. Comment on “Recent subsidence of the Venice Lagoon from continuous GPS and interferometric synthetic aperture radar” by Y. Bock, S. Wdowinski, A. Ferretti, F. Novali, and A. Fumagalli. Geochem. Geophys. Geosyst. 13, Q07008 (2012). [Google Scholar]
- Tosi L., Teatini P. Carbognin L. & Frankenfield J. A new project to monitor land subsidence in the northern Venice coastland (Italy). Environ. Geol. 52, 889–898 (2007). [Google Scholar]
- Altamimi Z., Sillard P. & Boucher C. ITRF2000: A new release of the International Terrestrial Reference Frame for Earth science applications. J. Geophys. Res. 107, 2214 (2002). [Google Scholar]
- Altamimi Z., Collilieux X., Legrand J., Garayt B. & Boucher C. ITRF2005: A new release of the International Terrestrial Reference Frame based on time series of station positions and Earth Orientation Parameters. J. Geophys. Res. 112, B09401 (2007). [Google Scholar]


