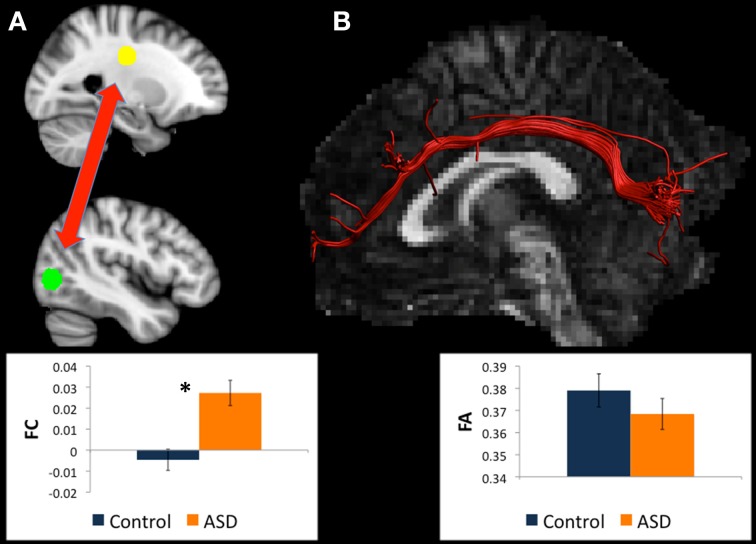
Figure 3.
(A) Regions for tractography in left BA19 (green sphere) and left caudate body (yellow sphere). The ASD group showed increased functional connectivity relative to controls between these regions during a mental rotation task. The bar graph shows the strength of functional connectivity (FC) in the Control group (blue) and ASD group (orange) between these regions. (B) Example of white matter tracts that directly connect the left BA19 and left caudate body regions in one participant. The bar graph shows Fractional Anisotropy (FA) in the Control group (blue) and ASD group (orange) in these white matter tracts. *indicates statistical significance with p < 0.05.

