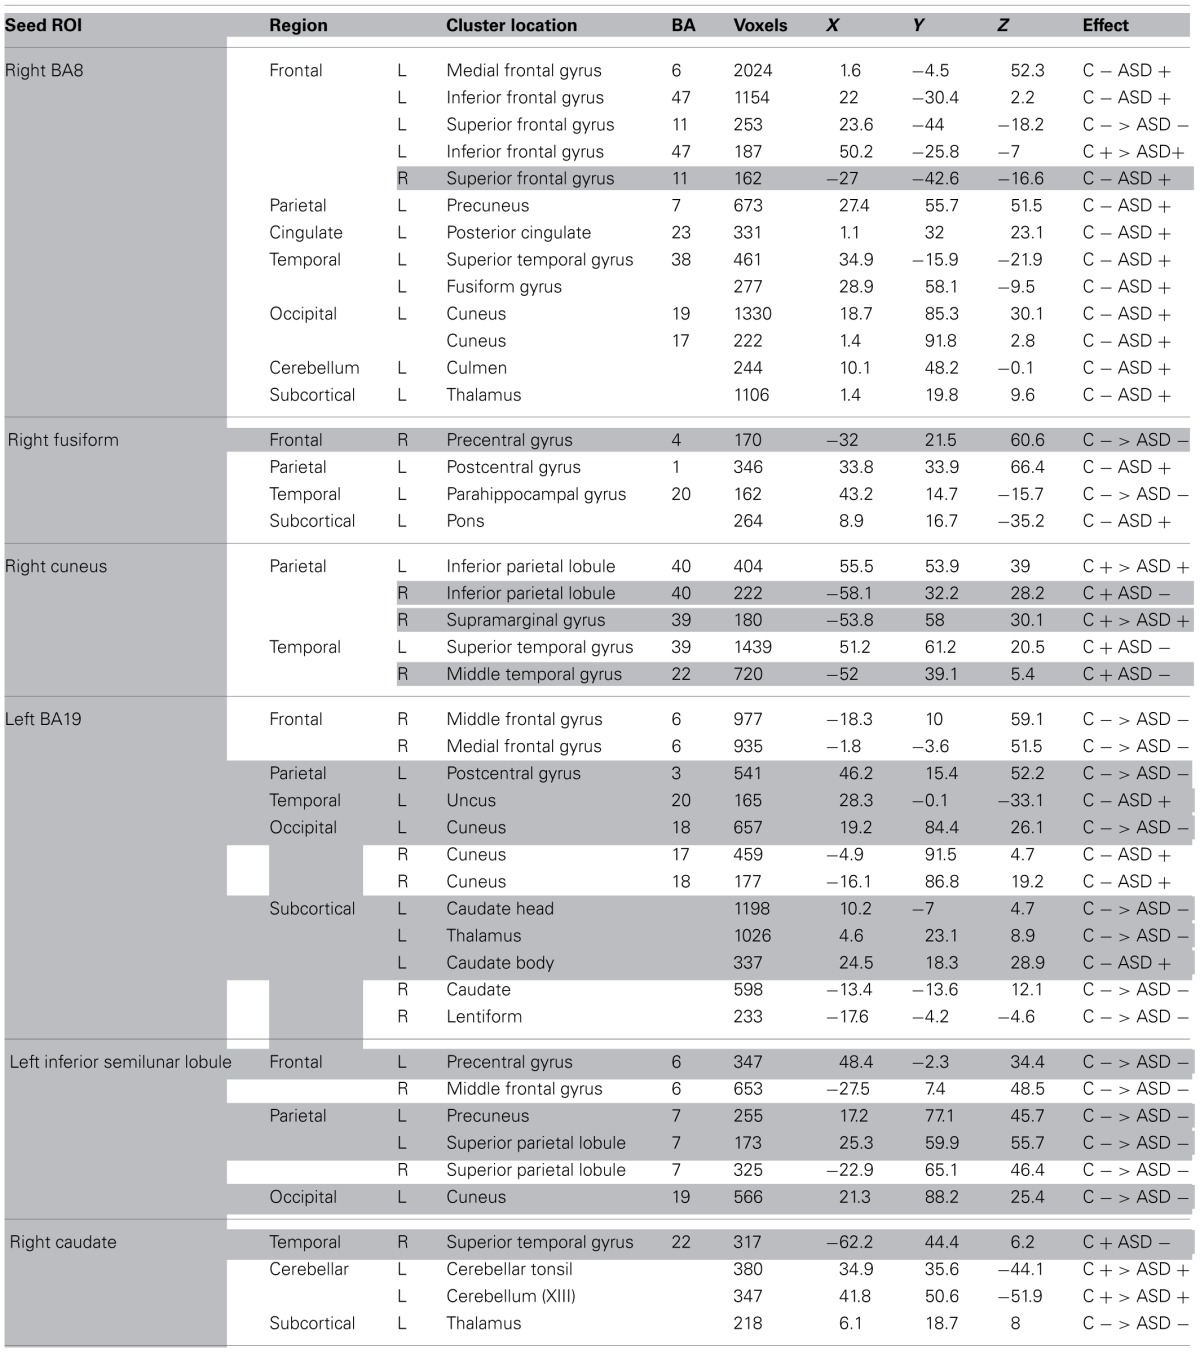
Table 2.
A modified version of Table 3 in McGrath et al. (2012), in which the results of between-group differences in functional connectivity are summarized.

Gray shading indicates ipsilateral brain region pairs that were used as regions of interest for CSD based tractography in the current study. [Direction of between-group difference denoted with arrows (–, Negative functional connectivity, +, Positive functional connectivity), >, greater than (note that when both groups show negative connectivity the > means a larger negative value), C, Control group, ASD, Autism Spectrum Disorder group].
