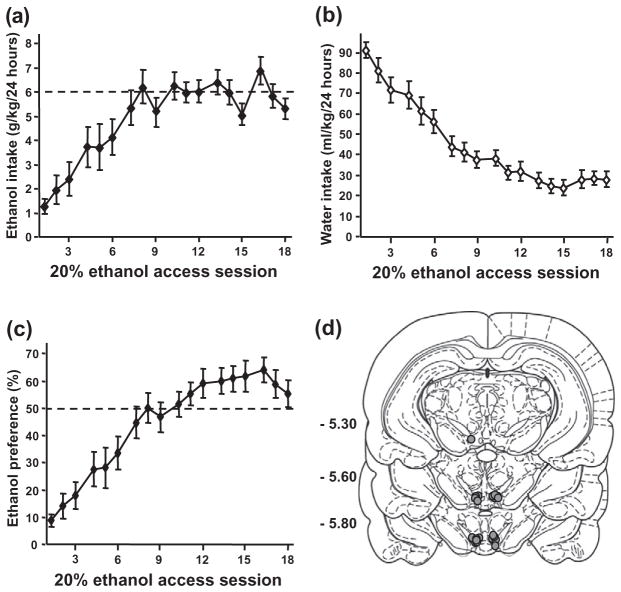
Figure 2.
Escalation of ethanol intake and preference in an intermittent access two-bottle choice paradigm and representation of the cannulae placement. (a–c), Mean ±standard error of the mean (SEM) of ethanol (a), water (b) intake and ethanol preference (c) during acquisition of voluntary consumption of a 20% ethanol solution. (d), Schematic representation of the cannulae placement on coronal section (Paxinos & Watson 2007). The location of the injector tips is represented by gray circles. Numbers on the left side indicate the distance posterior to bregma in millimeters. n = 13

