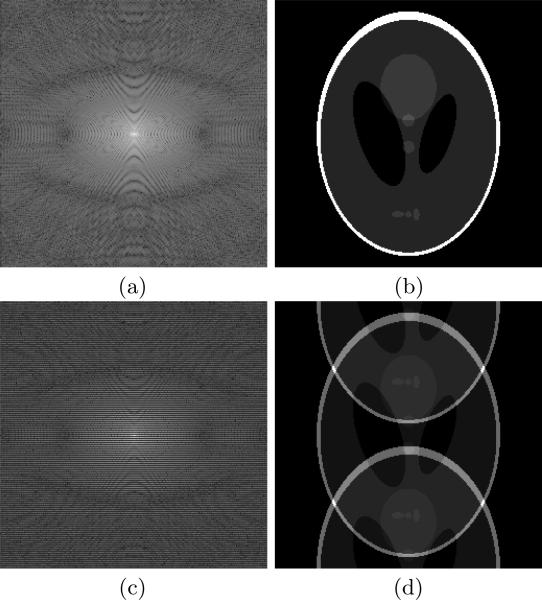
Figure 4.
Illustration of MR image and the k-space data: (a) the full k-space data (displayed in logarithmic scale), (b) the image obtained by applying inverse Fourier transform to (a), (c) the undersampled k-space (displayed in logarithmic scale), and (d) the image obtained by applying inverse Fourier transform to (c).

