
Figure 1.
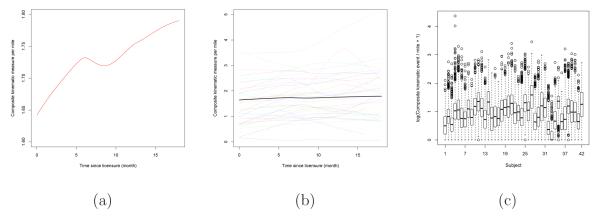
Exploratory analysis for composite kinematic events in NTDS: (a) Overall smoothed LOWESS curve of the composite kinematic event for all trips in the study; (b) Individual smoothed LOWESS curves (dotted line for each driver) compared to the overall LOWESS curve (thicker line); (c) Individual box plots for loge(composite kinematic events/mile + 1).